Download
1 / 2
20 likes | 164 Views
Abstract.

E N D
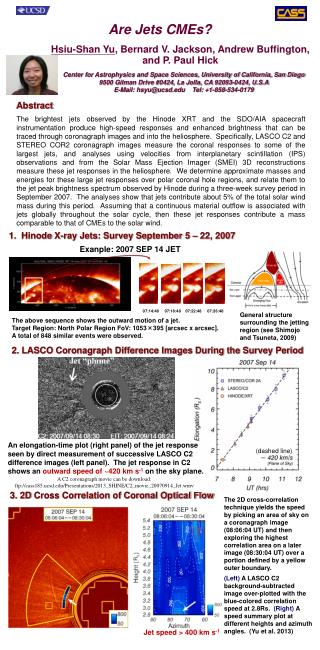
Abstract The brightest jets observed by the Hinode XRT and the SDO/AIA spacecraft instrumentation produce high-speed responses and enhanced brightness that can be traced through coronagraph images and into the heliosphere. Specifically, LASCO C2 and STEREO COR2 coronagraph images measure the coronal responses to some of the largest jets, and analyses using velocities from interplanetary scintillation (IPS) observations and from the Solar Mass Ejection Imager (SMEI) 3D reconstructions measure these jet responses in the heliosphere. We determine approximate masses and energies for these large jet responses over polar coronal hole regions, and relate them to the jet peak brightness spectrum observed by Hinode during a three-week survey period in September 2007. The analyses show that jets contribute about 5% of the total solar wind mass during this period. Assuming that a continuous material outflow is associated with jets globally throughout the solar cycle, then these jet responses contribute a mass comparable to that of CMEs to the solar wind. Are Jets CMEs? Hsiu-Shan Yu, Bernard V. Jackson, Andrew Buffington, and P. Paul Hick Center for Astrophysics and Space Sciences, University of California, San Diego 9500 Gilman Drive #0424, La Jolla, CA 92093-0424, U.S.A E-Mail: hsyu@ucsd.edu Tel: +1-858-534-0179 1. Hinode X-ray Jets: Survey September 5 – 22, 2007 Exanple: 2007 SEP 14 JET General structure surrounding the jetting region (see Shimojo and Tsuneta, 2009) The above sequence shows the outward motion of a jet. Target Region: North Polar Region FoV: 1053×395 [arcsec x arcsec]. A total of 848 similar events were observed. 07:14:48 07:18:48 07:22:48 07:26:48 2. LASCO Coronagraph Difference Images During the Survey Period An elongation-time plot (right panel) of the jet response seen by direct measurement of successive LASCO C2 difference images (left panel). The jet response in C2 shows an outward speed of ~420 km s-1on the sky plane. (dashed line) A C2 coronagraph movie can be download:ftp://cass185.ucsd.edu/Presentations/2013_SHINE/C2_movie_20070914_Jet.wmv 3. 2D Cross Correlation of Coronal Optical Flow The 2D cross-correlation technique yields the speed by picking an area of sky on a coronagraph image (08:06:04 UT) and then exploring the highest correlation area on a later image (08:30:04 UT) over a portion defined by a yellow outer boundary. (Left) A LASCO C2 background-subtracted image over-plotted with the blue-colored correlation speed at 2.8Rs. (Right) A speed summary plot at different heights and azimuth angles. (Yu et al. 2013) Jet speed > 400 km s-1
4. SMEI 3D Jet Analysis: 2007 SEP 14 JET θ φ 2007/09/17 06 UT 25°N Volumetric analysis using data from panel (e), to left Speed: ~ 525 km/s Mass: ~1014g Energy:~1029ergs 0°N SMEI jet location with increasing solar distance (density normalized to 1AU) 5. Jet’s Mass Contribution to Solar Wind We have tracked the response to three particularly large X-Ray jets from the Hinode XRT observations through the LASCO C2 and STEREO COR2A coronagraph fields of view and into the SMEI data set for analysis during September 2007. These jet responses all have similar masses ~1014g and energies ~1029ergs. (Left) A spectrum for the intensity of the 848 X-ray polar jets observed by Hinode. The three jets tracked here are the largest and brightest responses duringthree-week survey period as marked by an arrow. This coverage is estimated to be 13% of the total intensity assuming jets are the same all over the Sun. Further, if we assume that the total X-ray brightness of the jet is proportional to the mass contained in the jet, i.e. mass expelled out from the corona when the X-ray jet occurred, we obtain that the jets contribute ~5% mass and ~2% energy to the solar wind. Power-law Index: -1.8 13% coverage of the total intensity (Sako et al., 2010) Jet-tracked 6. Summary • The high speed responses measured in LASCO C2 coronagraph images show an association with Hinode jets. • Jet responses measured in LASCO C2 and STEREO COR2 are also observed in the Solar Mass Ejection Imager (SMEI) analysis. • We can determine the mass contained in a jet, the volume of a jet and its speed by tracing its density in the 3D SMEI analysis. • The jets contribute ~5% mass and ~ 2% energy to the solar wind, as estimated by Ulysses observations. Primary References: Sako, N., Shimojo, M., Kitabayashi, T., 2010, “Statistical study of the polar X-ray jets”, 38th COSPAR Scientific Assembly, E21-0018-10. Shimojo, M., and Tsuneta, S., 2009, “The relation between magnetic fields and coronal activities in the polar coronal hole”, Astrophys. J., 706, L145-L149.. Yu, H.-S., Jackson, B. V., Clover, J. M., and Buffington, A., 2013, “The Analysis of Polar Jet Responses Using Images From the LASCO C2 and STEREO COR 2 Coronagraphs”, in Solar Wind Thirteen, (in press).