Download
1 / 33
330 likes | 343 Views
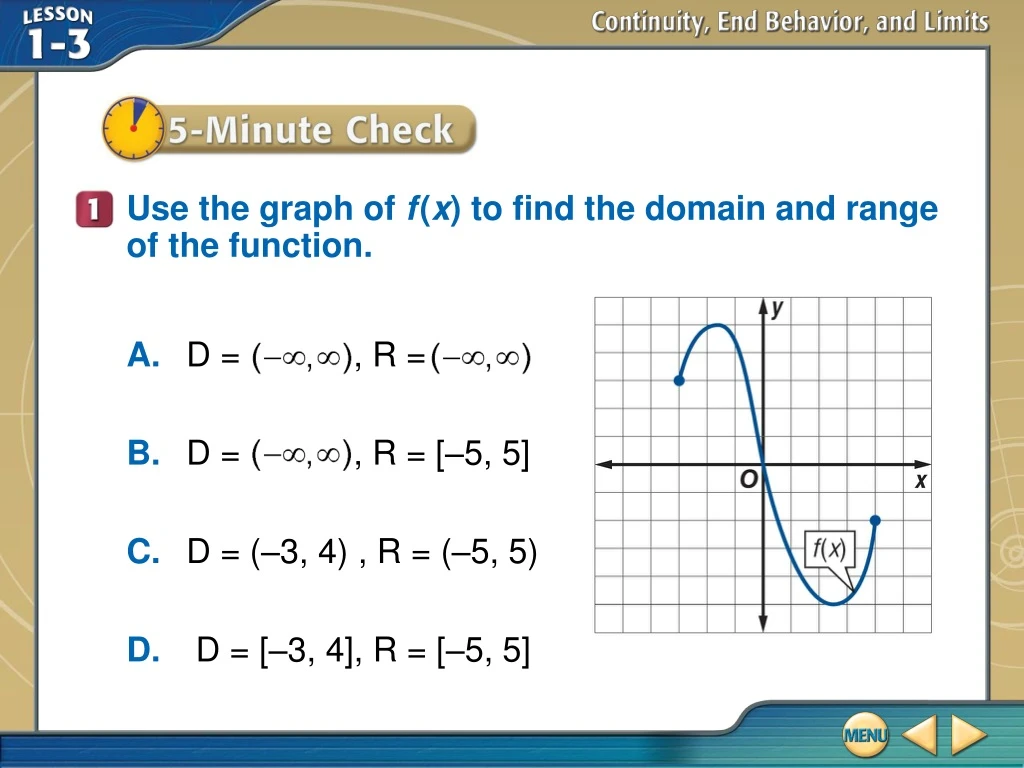
A. D = , R = B. D = , R = [–5, 5] C. D = (–3, 4) , R = (–5, 5) D. D = [–3, 4], R = [–5, 5]. Use the graph of f ( x ) to find the domain and range of the function. 5–Minute Check 1. A. D = , R = B. D = , R = [–5, 5] C. D = (–3, 4) , R = (–5, 5)

E N D
A.D = , R = B.D = , R = [–5, 5] C.D = (–3, 4) , R = (–5, 5) D.D = [–3, 4], R = [–5, 5] Use the graph of f(x) to find the domain and range of the function. 5–Minute Check 1
A.D = , R = B.D = , R = [–5, 5] C.D = (–3, 4) , R = (–5, 5) D.D = [–3, 4], R = [–5, 5] Use the graph of f(x) to find the domain and range of the function. 5–Minute Check 1
continuous function • limit • discontinuous function • infinite discontinuity • jump discontinuity • removable discontinuity • nonremovable discontinuity • end behavior Vocabulary
Determine whether is continuous at . Justify using the continuity test. 1. Does exist? Because , the function is defined at Identify a Point of Continuity Check the three conditions in the continuity test. Example 1
3. Does ? Because is estimated to be and we conclude that f(x) is continuous at . The graph of f(x) below supports this conclusion. Identify a Point of Continuity Example 1
Answer:1.2. exists. 3. . f(x) is continuous at . Identify a Point of Continuity Example 1
A. continuous; f(1) B. Discontinuous; the function is undefined at x = 1 because does not exist. Determine whether the function f(x) = x2 + 2x – 3 is continuous at x = 1. Justify using the continuity test. Example 1
A. continuous; f(1) B. Discontinuous; the function is undefined at x = 1 because does not exist. Determine whether the function f(x) = x2 + 2x – 3 is continuous at x = 1. Justify using the continuity test. Example 1
A. Determine whether the function is continuous at x = 1. Justify using the continuity test. If discontinuous, identify the type of discontinuity as infinite, jump, or removable. 1. Because is undefined, f(1) does not exist. Identify a Point of Discontinuity Example 2
Identify a Point of Discontinuity 3. Because f(x) decreases without bound as x approaches 1 from the left and f(x) increases without bound as x approaches 1 from the right, f(x) has an infinite discontinuity at x = 1. The graph of f(x) supports this conclusion. Answer: Example 2
Identify a Point of Discontinuity 3. Because f(x) decreases without bound as x approaches 1 from the left and f(x) increases without bound as x approaches 1 from the right, f(x) has an infinite discontinuity at x = 1. The graph of f(x) supports this conclusion. Answer:f(x) has an infinite discontinuity at x = 1. Example 2
B. Determine whether the function is continuous at x = 2. Justify using the continuity test. If discontinuous, identify the type of discontinuity as infinite, jump, or removable. 1. Because is undefined, f(2) does not exist. Identify a Point of Discontinuity Therefore f(x) is discontinuous at x = 2. Example 2
3.Because exists, but f(2) is undefined, f(x) has a removable discontinuity at x = 2. The graph of f(x) supports this conclusion. 4 Identify a Point of Discontinuity Answer: Example 2
3.Because exists, but f(2) is undefined, f(x) has a removable discontinuity at x = 2. The graph of f(x) supports this conclusion. 4 Identify a Point of Discontinuity Answer:f(x) is discontinuous at x = 2 with a removable discontinuity. Example 2
Determine whether the function is continuous at x = 1. Justify using the continuity test. If discontinuous, identify the type of discontinuity as infinite, jump, or removable. A. f(x) is continuous at x = 1. B. infinite discontinuity C. jump discontinuity D. removable discontinuity Example 2
Determine whether the function is continuous at x = 1. Justify using the continuity test. If discontinuous, identify the type of discontinuity as infinite, jump, or removable. A. f(x) is continuous at x = 1. B. infinite discontinuity C. jump discontinuity D. removable discontinuity Example 2
A. Determine between which consecutive integers the real zeros of are located on the interval [–2, 2]. Approximate Zeros Investigate function values on the interval [-2, 2]. Example 3
Approximate Zeros Because f(-1) is positive and f(0) is negative, by the Location Principle, f(x)has a zero between -1 and 0. The value of f(x) also changes sign for [1,2]. This indicates the existence of real zeros in each of these intervals. The graph of f(x) supports this conclusion. Answer: Example 3
Approximate Zeros Because f(-1) is positive and f(0) is negative, by the Location Principle, f(x)has a zero between -1 and 0. The value of f(x) also changes sign for [1,2]. This indicates the existence of real zeros in each of these intervals. The graph of f(x) supports this conclusion. Answer:There are two zeros on the interval, –1 < x < 0 and 1 < x < 2. Example 3
B. Determine between which consecutive integers the real zeros of f(x) = 3x3 – 2x2 + 3 are located on the interval [–2, 2]. A. –2 < x < –1 B. –1 < x < 0 C. 0 < x < 1 D. 1 < x < 2 Example 3
B. Determine between which consecutive integers the real zeros of f(x) = 3x3 – 2x2 + 3 are located on the interval [–2, 2]. A. –2 < x < –1 B. –1 < x < 0 C. 0 < x < 1 D. 1 < x < 2 Example 3
Graphs that Approach Infinity Use the graph of f(x) = x3 – x2 – 4x + 4 to describe its end behavior. Support the conjecture numerically. Example 4
Answer: Graphs that Approach Infinity The pattern of outputs suggests that as x approaches –∞, f(x) approaches –∞ and as x approaches ∞, f(x) approaches ∞. Example 4
Use the graph of to describe its end behavior. Support the conjecture numerically. Graphs that Approach a Specific Value Example 5
Answer: Graphs that Approach a Specific Value Example 5
Use the graph of to describe its end behavior. Support the conjecture numerically. A. B. C. D. Example 5
Use the graph of to describe its end behavior. Support the conjecture numerically. A. B. C. D. Example 5
PHYSICS The symmetric energy function is . If the y-value is held constant, what happens to the value of symmetric energy when the x-value approaches negative infinity? We are asked to describe the end behavior of E(x) for small values of x when y is held constant. That is, we are asked to find . Apply End Behavior Example 6
Because y is a constant value, for decreasing values of x, the fraction will become larger and larger, so . Therefore, as the x-value gets smaller and smaller, the symmetric energy approaches Answer: Apply End Behavior Example 6