Download
1 / 29
290 likes | 302 Views
This project aims to develop a grid-based infrastructure to support the analysis of medical imaging markers for Alzheimer's disease. The infrastructure includes pipelines, algorithms, and toolkits for data mining, allowing physicians to diagnose diseases, measure disease evolution, assess treatment efficacy, and further understand diseases and brain anatomy.

E N D
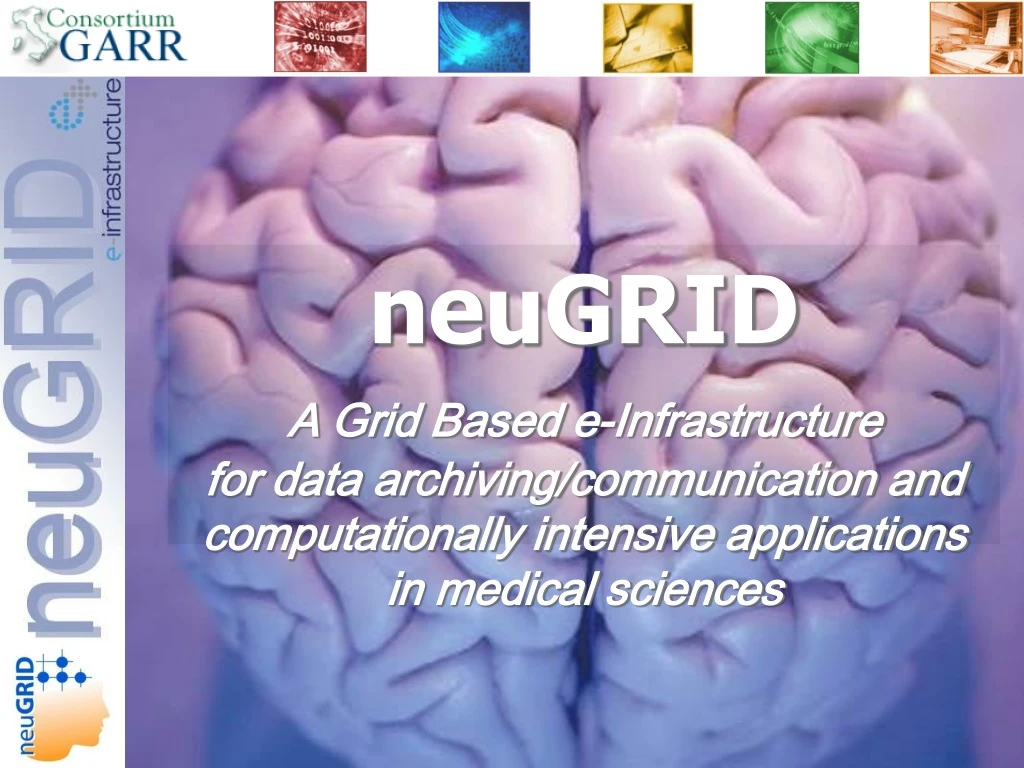
neuGRID A Grid Based e-Infrastructure for data archiving/communication and computationally intensive applications in medical sciences
VrijeUniversiteit Medical Centre, THE NETHERLANDS Frederik Barkhof CF consulting s.r.l., ITALY Carla Finocchiaro University of the West of England, Bristol, UK Richard McClatchey, Technical Supervisor MaatGknowledgeSL, SPAIN David Manset HealthGrid, FRANCE Yannick Legré, Tony Solomonides Project Introduction National Alzheimer’s CentreFatebenefratelli, Brescia, ITALY GB Frisoni, Coordinator Karolinskainstitutet, SWEDEN Lars-Olof Wahlund ProdemaGmbH, SWITZERLAND Christian Spenger, Alex Zijdenbos
Imaging Markers for Alzheimer’s Gray Matter Loss Isolated Early Consolidated Memory Disability Disability Problems
Imaging Markers & Pipelines Toolkits • What are markers used for? • To support physicians in diagnosing diseases, • To measure disease evolution, • To assess treatment(s)/drug(s) efficacy,supporting pharma • industries in drug developments, • To further understand diseases and brain anatomy and functions • How do such markers materialize? • Data mining Algorithms and Pipelines of Algorithms • Heterogeneous Algorithms and Pipelines toolkits (I.e. FSL, MRIcron, FreeSurfer, MNI/BIC, LONI, SPM, etc..)
ImagingMarkers Pipelines Characteristics Pipeline Anatomy • Pipelines encompass Knowledge • Pipelines are Heterogeneous • Pipelines are sometimes Interactive • Pipelines are Iterative and Recursive • Pipelines are mainly Task-based • Pipelines are mainly Sequential • Pipelines are Computing Intensive • Pipelines are Data Intensive
TODAY COMPUTATIONAL CENTRE
TOMORROW neuGRID
TOMORROW neuGRID
System Architecture (3/3)Service Oriented Architecture HighlySpecialized Interfaces Portal (A series of *web* interfaces exposing the functionality to end-users from login, to data acquisition, quality control, Workflow authoring ... and much more! The Portal approach beyond accessibility advantages, allows harmonizing the software offer) Web Common Purpose Interfaces Business Logic (NeuroSciences Specific Services) Specific to Project (cantheoreticallybepartlyreused in similarprojectssince abstractedfromunderlying IT) Privacy (All services necessary to guaranty privacy Over medical data storage, access and Sharing. Privacy related services must conform with ethical EU/National regulations) Workflow Management (SOA Governance is in charge of defining, accessing, executing, operating and maintaining reusable services with appropriate quality of services and conforming with all other requirements, e.g. Security, privacy...) Security (All services concerned with authentication, authorization within the neuGRID platform) Domain Logic (Medical Generic Services) Monitoring, Logging and Accounting (Provides the mechanisms to store, archive and sort all log information. The layer is concerned with services which allow efficient monitoring of all infrastructure resources , and from which higher level logic such as Provenance can extract useful historical data) Generic to Medicaldomain (cantheoreticallybereused in othermedical applications) Backends Abstraction (Software abstraction from databases, grid, enactment environments...) Generic to ALL domains (cantheoreticallybefullyreused) Backends Middleware (Underlying IT legacy assets, e.g. EGEE gLite, mySQL, LONI, Oracle 11g...)
neuGRIDInfrastructure LORIS SlaveLORIS SlaveLORIS SlaveLORIS LEVEL 0 Deployedsince Sept 2008 Data Coordination Center Grid Coordination Center 20 Mb/s DEPLOYED AUG 2009 DEPLOYED APR 2009 Expected SEP 2009 Provenance Pipeline LEVEL 1 GridSOAWorkflow All DACS Sites connected to GEANT2 Network Scalable Robust Distributed DACS1 DACS3 DACS2 100 Mb/s 100 Mb/s 1 Gb/s USERS Exploitation 2010 Pipelining Corelab New Markers
Prototype Web Portal (2/3) Web Interface • Web Portal • AJAX-based Portal • CAS SSO Framework • Grid Proxy Applet • MyProxy Session • Solution Highlights • Simple and standard Web portal • No third party software installations required, • Cross-OS solution, • Lightweightaccess to large Grid infrastructure, • Integrateslatestsecurity and Web standards
Data Acquisition & Quality Control (1/3) LORIS Database • LORIS Database • Connected to SSO • Interfaces to Data Acq • Interfaces to Data QC • Basic Data Visualisation • Solution Highlights • Data acquisition and management interfaces, • CLIsprovided for use in the Grid, • Quality Control interfaces • MANTA tracking system, • JIV Viewerfor displaying scans, • Simple query interface to interactwith the archive.
Data Acquisition & Privacy (3/3) Pseudonymization & Defacing SlaveLORIS SlaveLORIS LEVEL 1 Abstraction Abstraction Abstraction SlaveLORIS DACS3 DACS2 DACS1 CE DPM WNn SE 1. From Imaging Appliances to the Grid: Pseudonymization 2. Within the Grid: Defacing (face scrambling by removing nose/mouth areas from the images 3. Data import from the Grid to the LORIS Database. Data quality control. 2-levelanonymization to avoidbackwardtraceability of patients’ identityfrommetadata and/or 3D face reconstruction
Accessing the Grid (1/2) Online Grid Shell • Online Shell Access • GSISSH Applet • Access to Grid Infra. • CIVET Pipeline gridified • SFTP Facility to Upload • Solution Highlights • Shell-likefacility, full scriptingenvironment, • Outsideresearcherscanupload and processtheirown data withoutinstallinganyGridrelated software, • Direct access to gridified pipelines and algorithms, • GSISSH applet fromNHS
Accessing the Grid (1/2) Desktop Fusion • Desktop Fusion • Remote Desktop • VO Box to use the Grid • File Sharing • Post-processingtools • Solution Highlights • Combines a high performance remote desktop • technology (i.e. NX Nomachine) withVO-Box, file sharing • and advanced data miningtools: • - Neuroimagingtoolkits: MRIcron, FSL, BIC, LONI Pipeline • - Scripting environment: gLiteUI, generic file browser etc • Gentoogeneric file browser used as a switchtender to more advanced applications • Allowsresearchers to automaticallysharetheir desktop and thusuploadseamlesslymedical data to beprocessed
Neuroscientific Pipelines Gridification The CIVET Example
CIVET Pipeline Gridification • CIVET Pipeline Characteristics • 7 hoursof processing on 1 single scan usingstandard CPU • Data intensive, cancreate up to 10x input data. Output of 1 processed scan ~100MB • Varioussoftware dependencieshave been identified • Gridifiedboth 32/64-bit versions * CIVET Execution Trace
CIVET Pipeline Pipeline Description Alzheimer's characterized by heterogeneous distribution of pathological changes throughout the brain. One marker for the disease-specific atrophy is the thickness of the cortical mantle across the brain Non uniformity correction, skull masking and tissue classification * CIVET Representation in LONI Pipeline Cortex masking and surface extraction Gyrification index, resampling of surface and cortical thickness • 46 processingsteps, • Involving59 modules using a combination of MINC routines (22 routines in total) • Varioussoftware dependencies(i.e. R, MINC, BIC etc)
CIVET Output (2/2) Alzheimer’sDisease LINK to the neuGRID PORTAL
Data Challenge (1/3) Analyzingthe US-ADNI Database • Alzheimer’sDiseaseNeuroimaging Initiative • To help researchers and clinicians in developing new treatments and testingtheirefficacy, • The ADNI is a multisite, multiyear program which began in October 2004, • More than 700 subjects recruited, 200 elderly controls, 400 with mild cognitive impairment (MCI) and 200 with Alzheimer's disease (AD) • Subjects have been followed for 2-3 years and have been seen approximately every 6 months
Data Challenge (2/3) Facts & Figures ExpectedResults
Data Challenge (3/3) A DifficultStart… DEFCON3 DEFCON1 DEFCON4 Power cut @ FBF DACS1 site site disappeared from infra, all jobs rescheduled automatically to KI DACS2 site Out of Memory @ KI DACS2 site BUG: WMS Condor-G submits grid_monitor ignoring VOMS FQANs (in the WMS) Live update of FBF DACS1 site from lcg-CE i386 3.1.33-0 to lcg-CE i386 3.1.34-0 t0 t1 t2 t4 t3 t6 t5
International Cooperation RelatedInitiatives • CBRAIN - Canadian Brain Imaging Research Network • Recently funded by CANARIE (Canadian Advanced Network and Research for Industry and Education) • UCLA LoNI – Pipeline Environment • Potential infrastructure of: • 6’000 Cores for 200TB of storage • Offering advanced capabilities: • State-of-the-art • Main Statistical Toolkits • - A wide range of • generic medical services A Worldwide Neuroscience Network?