Download
1 / 18
180 likes | 197 Views
THE EU LISBON STRATEGY FOR GROWTH AND JOBS. Special European Council held in Lisbon, 23-24 th March 2000 Very good macroeconomic conditions: wage moderation, low inflation and low interest rates

E N D
THE EU LISBON STRATEGY FOR GROWTH AND JOBS • Special European Council held in Lisbon, 23-24th March 2000 • Very good macroeconomic conditions: wage moderation, low inflation and low interest rates • On the other hand, low economic growth during the 1990s: GDP and employment growth in the EU was much lower than in the US
GDP, employment and productivity: percentage change on previous year
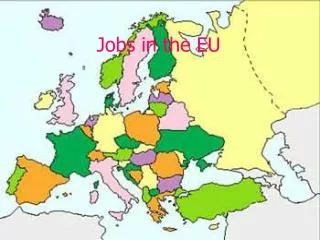
How to improve the EU growth performance? • Emphasis on knowledge, innovation and education (make the EU “the most dynamic and competitive knowledge economy of the world by 2010”) Some of the (many) goals to be achieved in 2010 • A 3% share of R&D expenditures on GDP (2/3 of them financed by the business sector) • A Community patent • An employment rate from 61% to 70% (for women: from 51% to 60%)
The Lisbon targets were not achieved (and this is not because of the 2008 crisis) • The EU employment rate reached 66% in 2008 (from 62% in 2000) • Total R&D expenditures on GDP moved from 1.8% in 2000 to 1.9% in 2008 • A community patent will be introduced probably in 2016
Explaining the disappointing performance • The Lisbon strategy contained too many goals • It was not strongly linked with other EU policies • No authority effectively controlled the implementation of the Member States • Most importantly: limited resources were devoted to growth policies • The Obama Administration spent $787 billion (about €565 billion; 5% of US GDP) for stimulating the economy after the 2008 crisis • The total budget of the EU is € 960 billion in seven years (2014-2020: 1% of annual GDP)
Europe 2020: a strategy for smart, sustainable and inclusive growth. Launched in 2010: five main targets • Employment: 75% of the 20-64 year-olds to be employed (68.3% in 2013): this means about 20.6 million new jobs in seven years, a bit more than the population of Romania, the 7th more populated country of EU28 • R&D/innovation: 3% of the EU GDP (public and private combined) to be invested in R&D/innovation • Climate change/energy: greenhouse gas emissions 20% (or even 30%) lower than 1990; 20% of energy from renewable sources; 20% increase in energy efficiency
Education: Reducing school drop-out rates below 10%; at least 40% of 30-34–year-olds completing third level education Too many young people leave education/training without qualifications and jobs (NEET: Not (engaged) in Education, Employment or Training) Only under a third of Europeans aged 25-34 have a university degree (40% in the US, over 50% in Japan) • Poverty/social exclusion: at least 20 million fewer people in or at risk of poverty and social exclusion
Risk of replicating the failure of Lisbon strategy • Lack of financial resources (see slide n. 7) • Too much emphasis on reducing public debt and deficit. How governments under high fiscal consolidation pressure (i.e. compelled to implement austerity policies) can find the resources for investing in Europe 2020 goals? • Emphasis of the need of increasing the weight of manufacturing on GDP (from 16% to 20%), but little attention on how such a goal should be achieved • Competitiveness based on cost reductions?
K. Aiginger, Industrial policy for a sustainable growth path, 2014, wwwforeurope policy paper n. 13 • In principle, countries have two ways to increase dynamics of the economy or to reduce unemployment. One is to lower costs (wages, taxes, energy prices); the other is to raise productivity, by boosting capabilities (education, innovation), and by becoming a leader in energy efficiency and renewable energy • We label the first path to regain competitiveness a “low-road strategy” and the second a “high-road strategy” • It is difficult for countries with high wages to increase per-capita GDP by reducing wages, because low-income countries have greater competitive advantages in this aspect • Industrialised countries can more successfully compete on quality, innovation and new services
Taking stock of the Europe 2020 strategy • In March 2014, the Commission published a Communication taking stock of the Europe 2020 strategy, including an overview of progress on the 2020 targets • The EU is on course to meet or to come close to its education, climate and energy targets • We are not on track to meet our employment, research and development or poverty reduction goals • In any case, results and forecasts vary widely across Member States
The 2008 economic crisis • In 2009, the European economy suffered an unprecedented blow: a contraction of 4.5% in GDP • A temporary respite in economic decline in 2010 proved short lived and the negative trend continued in 2011-2012 • A gradual recovery has set in since 2013 and is expected to continue, with real GDP projected to grow again by 1.5% in 2014 and 2.0% in 2015 • According to the latest forecasts, the EU annual GDP growth could be in the order of 1.6% throughout the period 2014-2020, compared to 2.3% over 2001-2007 • Expressed in GDP per capita, average annual growth in the EU would thus be in the order of 0.9% over 2014-2020, compared to 1.8% over 2001-2007
Europe 2020 targets are monitored by Eurostat This table focuses on those of major interest for our course
Employment rates in EU Member States (share of people employed, 20-64 age group)
Tertiary attainment rate in EU Member States (population aged 30-34 with completed tertiary education – ISCED levels 5 + 6)
ISCED - International Standard Classification of Education • ISCED LEVEL 2 - LOWER SECONDARY EDUCATION • 3 - UPPER SECONDARY EDUCATION • 4 - POST-SECONDARY NON-TERTIARY EDUCATION • 5 - SHORT-CYCLE TERTIARY EDUCATION • 6 -BACHELOR’S OR EQUIVALENT LEVEL • 7 - MASTER’S OR EQUIVALENT LEVEL • 8 -DOCTORAL OR EQUIVALENT LEVE