Download
1 / 4
40 likes | 168 Views
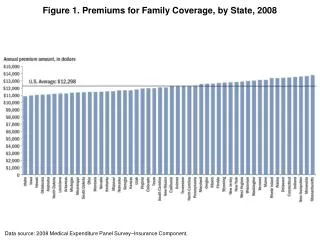
Figure 1. Premiums for Family Coverage, by State, 2008. Data source: 2008 Medical Expenditure Panel Survey – Insurance Component. 2003. 2008. NH. ME. WA. NH. VT. ME. WA. VT. ND. MT. ND. MT. MN. MN. OR. NY. MA. WI. OR. MA. NY. ID. SD. WI. RI. MI. ID. SD. RI. WY. MI.

E N D
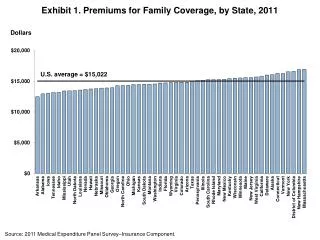
Figure 1. Premiums for Family Coverage, by State, 2008 Data source: 2008 Medical Expenditure Panel Survey–Insurance Component.
2003 2008 NH ME WA NH VT ME WA VT ND MT ND MT MN MN OR NY MA WI OR MA NY ID SD WI RI MI ID SD RI WY MI CT PA WY NJ CT IA PA NJ NE IA OH DE IN NE OH NV DE IN IL MD NV WV UT VA IL MD CO DC WV UT VA KS MO KY CA CO DC KS MO KY CA NC NC TN TN OK SC AR OK AZ NM SC AR AZ NM MS GA AL MS GA AL TX LA TX LA FL FL AK AK 18% or more HI HI 16%–17.9% 14%–15.9% Less than 14% Figure 2. Employer Premiums as Percentage of Median Household Income for Under-65 Population, 2003 and 2008 Data sources: 2003 and 2008 Medical Expenditure Panel Survey–Insurance Component (for average premiums for employer-based health insurance plans, weighted by single and family household distribution); 2004–2005 and 2008 Current Population Surveys (for median household incomes).
Figure 3. Premiums for Family Coverage, 2003, 2008, 2015, and 2020 Health insurance premiums for family coverage 1 1 2003: Lowest is North Dakota; highest is District of Columbia. 2008, 2015, and 2020: Lowest is Idaho; highest is Massachusetts. Data sources: Medical Expenditure Panel Survey–Insurance Component (for 2003 and 2008 premiums); Centers for Medicare and Medicaid Services, Office of the Actuary, National Health Statistics Group, national health expenditures per capita annual growth rate (for premium estimates for 2015 and 2020).
Figure 4. Projected Annual Savings in Family Premiums, 2015 and 2020 Data sources: Agency for Healthcare Research and Quality, Center for Financing, Access and Cost Trends, 2008 Medical Expenditure Panel Survey–Insurance Component (2008 premiums); Centers for Medicare and Medicaid Services, Office of the Actuary, National Health Statistics Group, national health expenditures per capita annual growth rate (premium estimates for 2015 and 2020).