Download
1 / 44
440 likes | 544 Views
Mohawk Jr-Sr High School PSSA/PVAAS. 2012. Act 82 – New Teacher Evaluation Law. Beginning in the 2013-2014 school year, fifty percent (50%) of the evaluation of classroom teachers shall be based on:

E N D
Act 82 – New Teacher Evaluation Law Beginning in the 2013-2014 school year, fifty percent (50%) of the evaluation of classroom teachers shall be based on: • Classroom observation and practice models that are related to student achievement in each of the following areas: (A) Planning and preparation. (B) Classroom environment. (C) Instruction. (D) Professional responsibilities.
Beginning in the 2014-2015 school year, nonteaching professional employes shall be evaluated using a rating tool designed specifically for nonteaching professional employes based on: Planning and preparation. Educational environment. Delivery of service. Professional development. Student performance of all students in the school building in which the nonteaching professional employe is employed which shall comprise twenty per centum (20%) of the overall rating of nonteaching professional employes
2. For classroom teachers, 50% of the overall rating of ashall be based upon multiple measures of student achievement. This ½ of the evaluation is divided into 3 parts: • (A) (15%) building level data including, but not limited to, all of the following: • Student performance on assessments. • Value-added assessment system data. • Graduation rate • Promotion rate. • Attendance rate • Advanced placement course participation. • SAT and PSAT data.
Fifteen per centum (15%) teacher specific data including, but not limited to, student achievement attributable to a specific teacher as measured by all of the following: • Student performance on assessments. • Value-added assessment system data. • Progress in meeting the goals of student’s IEP • Locally developed school district rubrics.
Twenty per centum (20%) elective data including measures of student achievement that are locally developed and selected by the school district from an approved list, including, but not limited to, the following: • District-designed measures and examinations. • Nationally recognized standardized tests. • Industry certification examinations. • Student projects. • Student portfolios.
No later than June 30, 2013, the department shall develop a rating tool that includes the weights given to the multiple measures of student performance • (1) Each rating tool developed or approved under this section shall identify the overall performance rating as one of the following: • (i) Distinguished. • (ii) Proficient. • (iii) Needs improvement. • Failing. • (2) An overall performance rating of either "distinguished" or "proficient" shall be considered satisfactory.
An overall performance rating of "needs improvement" shall be considered satisfactory, except… • that any subsequent overall rating of "needs improvement" issued by the same employer within ten (10) years of the first overall performance rating of "needs improvement" where the employe is in the same certification shall be considered unsatisfactory. • An overall performance rating of "failing" shall be considered unsatisfactory. • An overall performance rating of "needs improvement" or "failing" shall require the employe to participate in a performance improvement plan. No employe shall be rated "needs improvement" or "failing" based solely upon student test scores.
AYP – 3 Methods • Meeting targets • in every subgroup outright • Safe Harbor • Growth
SAFE HARBOR Reduce nonproficent students by 10% Ex. 100 students 80% Proficient 20% Nonproficient If target is 90%, need 10 more students to become proficient For safe harbor, need to reduce the nonproficientby 10% 10% of 20 = 2 students
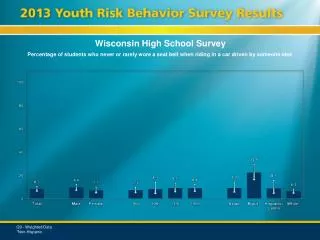
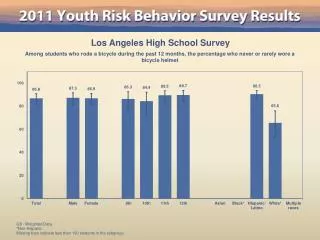
Using Safe Harbor, what % proficient must the HS meet in Reading? Math? Economically Disadvantaged Subgroup What % proficient for Reading? What % proficient for Math?
County PSSA Data Student Achievement – Where are we?
Achievement vs. Progress Achievement is absolute – what percentage of your students are proficient? • 2013 Targets: 89% for Math 91% for Reading • 2014 Targets: 100% for Math 100% for Reading The alternative path to achievement: Progress = Growth = Value-added Measurements If your building/students did not meet the AYP target, did they display one year of growth?
PVAAS Projections • What if you could know today who is most likely to be proficient this year? • Or who is close to being proficient? • Or who will need significant support? • What supports can you provide? • When/how? RTII
Student Projections See Handout
STEP 1: Log on to the PVAAS Website with user name and password. • https://pvaas.sas.com User names: First.Last • STEP 2: • Under Reports Tab, • Then under District Reports, • Click on: • Projection Summary (SINGLE TESTED GRADE)
Step 3: Under Grades tab, select the grade level the student was in last year. Step 4: Under the Projections tab, select the grade level the student is in this year, select the Subject, and the projection for Proficient. For students now in Grades 9, select Grade 11 subjects for Proficient.
This year’s AYP Math target increases from 78% to 89% Subgroups can be selected for further analysis (special ed, economically disadvantaged) In this chart, 83% of this year’s 7th grade is predicted to be proficient if they receive one year of growth. Step 5: Clicking on the underlined numbers will bring up the names of students in each category.
STEP 6: Click on the Achievement Probability for any one student.