Audit Sampling
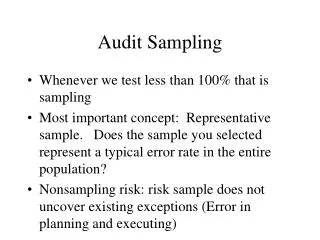
Audit Sampling. Audit Sampling Defined. SAS No. 39 defines audit sampling as the application of an audit procedure to less than 100 percent of the items within an account balance or class of transactions for the purpose of evaluating some characteristic of the balance or class (AU 350.01).

Audit Sampling
E N D
Presentation Transcript
Audit Sampling Defined SAS No. 39 defines audit sampling as the application of an audit procedure to less than 100 percent of the items within an account balance or class of transactions for the purpose of evaluating some characteristic of the balance or class (AU 350.01).
Advantages of Statistical Sampling • Design efficient samples • Measure sufficiency of evidence • Objectively evaluate sample results
Requirements of Audit Sampling Plans • When planning the sample consider: • The relationship of the sample to the relevant audit objective • Materiality or the maximum tolerable misstatement or deviation rate • Allowable sampling risk • Characteristics of the population • Select sample items in such a manner that they can be expected to be representative of the population • Sample results should be projected to the population • Items that cannot be audited should be treated as misstatements or deviations in evaluating the sample results • Nature and cause of misstatements or deviations should be evaluated
Selection of Random Sample • Random number tables • Random number generators • Systematic selection • Haphazard Selection Note that these methods are often used in conjunction with a stratification process.
Terminology • Sampling risk • Risk of assessing CR too high / Risk of incorrect rejection • Risk of assessing CR too low / Risk of incorrect acceptance • Precision (allowance for sampling risk)
Types of Statistical Sampling Plans • Attributes sampling • Discovery sampling • Classical variables sampling • Probability-proportional-to-size sampling
Attribute Sampling Applied To Tests Of Controls • Attribute sampling is a statistical method used to estimate the proportion of a characteristic in a population. • The auditor is normally attempting to determine the operating effectiveness of a control procedure in terms of deviations from the prescribed internal control.
Sampling Risk for Tests of Controls True State of Population Deviation Rate Deviation Rate Exceeds Is Less Than Auditors’ Conclusion Tolerable Rate Tolerable Rate From the Sample Is: Deviation Rate Exceeds Tolerable Rate Deviation Rate Is Less Than Tolerable Rate Correct Decision Incorrect Decision (Risk of Assessing Control Risk Too High) Incorrect Decision (Risk of Assessing Control Risk Too Low) Correct Decision
Attribute Sampling for Tests of Controls • Determine the objective of the test • Define the attributes and deviation conditions • Define the population to be sampled • Specify: • The risk of assessing control risk too low • The tolerable deviation rate • The estimated population deviation rate • Determine the sample size • Select the sample • Test the sample items • Evaluate the sample results • Document the sampling procedure Planning Performance Evaluation Documentation
Discovery Sampling • A modified case of attributes sampling • Purpose is to detect at least one deviation (i.e. critical deviations) • Useful in fraud detection • Auditor risk and deviation assessments: • Risk of assessing control risk too low (i.e. 5%) • Tolerable rate (normally set very low, i.e. < 2%) • Expected deviation rate is generally set at 0
Nonstatistical Attributes Sampling • Determination of required sample size • Must consider risk of assessing control risk too low and tolerable deviation rate • Need not quantify the risks • Evaluation of results • Compare tolerable deviation rate to sample deviation rate. Assuming appropriate n: • If SDR somewhat less than TDR, then conclude that risk of assessing control risk too low is set appropriately. • If SDR approaches TDR it becomes less likely that PDR < TDR • Must use professional judgment
Audit Sampling for Substantive Tests • Determine the objective of the test • Define the population and sampling unit • Choose an audit sampling technique • Determine the sample size • Select the sample • Test the sample items • Evaluate the sample results • Document the sampling procedure Planning Performance Evaluation Documentation
Audit Sampling for Substantive Tests Sampling Risk True State of Population Misstatement in Misstatement in Account Exceeds Account Is Less Auditors’ Conclusion Tolerable Amount Than Tolerable From the Sample Is: Amount Misstatement in Account Exceeds Tolerable Amount Misstatement in Account Is Less Than Tolerable Amount Correct Decision Incorrect Decision (Risk of Incorrect Rejection) Incorrect Decision (Risk of Incorrect Acceptance) Correct Decision
Risk of Incorrect Acceptance (RIA) Modification of audit risk model: AR = IR x CR x DR DR comprised of two types of substantive procedures, each with an associated type of risk: • Risk associated with AP and other procedures that do not involve audit sampling (AP) • Risk associated with procedures involving audit sampling (RIA) AR = IR x CR x AP x RIA RIA = AR /(IR x CR x AP)
Classic Variables Sampling • Mean per-unit estimation • Difference and Ratio Estimation • Appropriate when differences between audited and book values are frequent • Difference estimation is most appropriate when the size of the misstatements does not vary significantly in comparison to book value • Ratio estimation is most appropriate when the size of misstatements is nearly proportional to the book values of the items.
Mean Per-unit (MPU) EstimationDetermining the Sample Size N = population size Ur = incorrect rejection coefficient (Table 9-8) SDE = estimated population standard deviation A = planned allowance for sampling risk
Mean Per-unit (MPU) EstimationDetermining the Sample Size Standard deviation Population SD Sample SD
MPU Estimation Determining the Sample Size Calculation of planned allowance for sampling risk (A): TM = tolerable misstatement Ua = Incorrect acceptance coefficient (Table 9-8) Ur = incorrect rejection coefficient (Table 9-8)
MPU Estimation Adjusted Allowance for Sampling Risk Calculation of adjusted allowance for sampling risk (A´): TM = Tolerable misstatement Ua = Incorrect acceptance coefficient (Table 9-8) SDC = Sample (calculated) standard deviation n = sample size
MPU Estimation Estimated total audited value = Mean audited value x Number of accounts Acceptance interval = Estimated total audited value +/- Adjusted allowance for sampling risk Projected misstatement = Estimated total audited value – Book value of population
Nonstatistical Variables Sampling PBV = population book value RF = reliability factor (based on auditors’ combined assessment of inherent and control risk and the risk that other substantive procedures will fail to detect misstatements) (Table 9-13). TM = tolerable misstatement
Nonstatistical Variables Sampling • PM = projected misstatement • SNM = sample net misstatement • SBV = sample book value • PBV = population book value • Test: compare PM to TM. • Rule-of-thumb: if PM exceeds 1/3 of TM, PM “becoming too high”
Probability-proportional-to-size (PPS) Sampling • Applies the theory of attributes sampling to estimate the total dollar amount of misstatement in a population. • Population is defined by the individual dollars comprising the population’s book value ($1 = 1 item). • Relatively easy to use and often results in smaller sample sizes than classical variables approaches. • Assumptions underlying PPS sampling: • Expected misstatement rate in the population is small. • Amount of misstatement in physical unit should not exceed recorded BV of the item. • PPS focuses on overstatements.
PPS SamplingDetermination of Sample Size PBV = population book value RF = reliability factor (Table 9-14) TM = tolerable misstatement EM = expected misstatement EF = expansion factor (Table 9-15)
PPS SamplingSample Selection Systematic selection is generally used with PPS sampling: SI = sampling interval PBV = population book value n = sample size
PPS SamplingEvaluation of Sample Results Allowance for sampling risk ULM = upper limit on misstatement PM = projected misstatement BP = basic precision IA = incremental allowance
PPS SamplingEvaluation of Sample Results Projected misstatement (PM) • If BV < SI, PM = TF x SI TF = tainting factor = (BV – AV) / BV • BV = book value • AV = audit value • If BV > SI, PM = actual misstatement
PPS SamplingEvaluation of Sample Results Allowance for sampling risk • Basic precision = SI x RF0 • Incremental allowance If no misstatements in sample found, IA = 0 If misstatements found: For misstatements in which BV < SI, rank order projected misstatements from largest to smallest, multiply by corresponding incremental factor (from Table 9-14) and sum to calculate IA.
PPS SamplingEvaluation of Sample Results Compare ULM to TM: • If ULM < TM, conclude that population is not misstated by more than TM at the specified level of sampling risk. • If ULM > TM, conclude that the sample results do not provide enough assurance that the population misstatement is less than the TM and balance adjustment may be warranted.