Download
1 / 34
340 likes | 504 Views
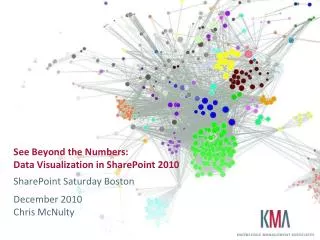
See Beyond the Numbers: Data Visualization in SharePoint 2010. SharePoint Saturday Boston December 2010 Chris McNulty. About Me. Working with SharePoint technologies since 2000/2001 20 years consulting and financial services technology (Santander, John Hancock, GMO, State Street )

E N D
See Beyond the Numbers:Data Visualization in SharePoint 2010 SharePoint Saturday Boston December 2010Chris McNulty
About Me • Working with SharePoint technologies since 2000/2001 • 20 years consulting and financial services technology (Santander, John Hancock, GMO, State Street) • MBA in Investment Management from Boston College Carroll School of Management • Write and speak often on Microsoft IW technologies • Microsoft MCSE/MCTS/MSA/MVTS • About KMA • Full-service IT consulting firm established in 1995 • 29 employees: Partner, PM, Analyst, Developer, QA • Microsoft technology focus: • Microsoft Gold Certified Partner / Working with SharePoint technologies since 2001 • Specialties in • Collaboration: Portals, Communities and Content Management • Insight: Enterprise Search and Business Intelligence • Productivity: Forms and Office Client Customization, Mekko Graphics (ISV)
Agenda • Goals, Terms & Surrounding Technology • Complexity Levels • Technology Overview and Demos • Simple List and Chart • Excel Services • Power Pivot • Pivot • BCS & SQL Server Reporting Services (SSRS) • Performance Point 2010 • Mapping • Summary • Resources • Questions and Answers • Contact Information
Microsoft SharePoint Server 2010 … the bright frontier Eastern Long Island, July 4, 2010
Complexity Levels of These Solutions Cost Time
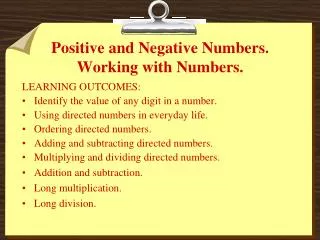
Goals for BI Design • Answering the known questions about our business • Allowing users to self-discover patterns and answers to questions we haven’t yet been asked
Terms • BCS – Business Connectivity Services • SSRS – SQL Server Reporting Services • Cube – a prebuilt matrix of data aggregations, hosted in SQL Server Analysis Services • Windows Azure DataMarket (fka Project Dallas) – Microsoft initiative to create publicly subscribed data services hosted on Azure and accessed via WCF, PowerPivot, etc. (http://www.sqlazureservices.com) • Pivot - Interaction model that accommodates the complexity and scale of a massive collection of information
SharePoint Charting • Native to SharePoint (Web Part) • Code-free solution – uses web part and native lists
SharePoint Charting • Data sources • Other Lists (Site Collection) • BCS/Business Data Catalog • Excel Services • Standard Types • Bar, Area, Line, Bubble, Financial, Pie, Radar, Polar, Gantt, Range, Error Bar, Box Plot, Funnel, Pyramid • Typical use - quick visualization of SharePoint data • Quick tip – use the wizard
Excel Services • Use the world’s #1 BI modeling tool • Render data, charts, interface using native Excel components (e.g. Slicers) • Data stored in Excel
Excel Services • Host a presentation layer using Excel Services • Closely related to Excel Web Access • Use native SharePoint Status Indicators (KPIs) • Can also work with lists • Render Excel 2010 functions (e.g. Slicers) without Excel 2010 on all clients • Use when users are skilled in Excel modeling and charting and data lives in spreadsheets • Quick tip: understand SSA’s
PowerPivot • “Project Gemini” – host 1-10MM row datasets • Excel and SharePoint components • Data doesn’t live in spreadsheet • Released with SQL Server 2008 R2 but doesn’t explicitly require the R2 Engine
PowerPivot • Like Excel Web Access except underlying data can be sourced from: • SQL, Analysis Services Cube, SSRS Report • Access • Power Pivot/Excel • Data Feeds (XML, Atom, Azure, WCF OData, Dallas) • Oracle, Teradata, Sybase, DB2 • ODBC • Text files • Excel optimized to handle data management and memory cache locally • SharePoint builds cache and optimizes for server web access • Use when Excel modeling skills are high but data is too large or too heterogeneous to keep in multiple Excel spreadsheets • Quick tip: www.powerpivotgeeks.net
Pivot • “Interact with massive amounts of data in ways that are powerful, informative, and fun” • Interaction model that accommodates the complexity and scale of information rather than the traditional structure of the Web • Create a “collection”- underlying schema is CXML or Collection XML. • View in SharePoint via Silverlight viewer • Complexity: Excel tool available • Tip: http://getpivot.com
Business Connectivity Services • Read write access to external data sources in SP2010 (aka Business Data Connectivity) • Pull data into SharePoint user interface • Push data into external sources
Business Connectivity Services • Native Support for data from SQL, .NET, Windows Communication Frameworks (e.g. Dallas) • Configured through SharePoint Designer 2010 • Republish data to consuming applications (e.g. Outlook 2010) • Use when key data lives outside SharePoint direct control – e.g. accounting systems • Quick tip: Secure Store Service is needed
SQL Server Reporting Services (SSRS) • “Code free” but requires development tools • Designed using Business Intelligence Developer Studio • Host in SQL Server or SharePoint
PerformancePoint 2010 • Dashboard Designer (browser downloadable) • Integrates Excel Services, SSRS, and Performance Point Elements
PerformancePoint 2010 • Sophisticated self service modeling • Decomposition Tree • Ideal for SSAS but also work with standard data sources (lists, SQL) • Requires true SQL development to build and maintain SSAS cubes for KPIs and scorecards
Mapping • IDC reports that nearly 80% of business data has a location component • Make business tools as engaging as what’s on the web • Use cases: • Customer base / trade areas • Routing and shipping • Targeted marketing • Supply chain & disruption resolution
2010 BI Solutions in SharePoint Large Datasets Visual Navigation Pivot PowerPivot PerformancePoint Mapping SharePoint list KPI / Status Indicator SQL Reporting Services Chart Web Part Excel Services Printing or exporting Small Datasets
Resources - General • From Microsoft: • Business Intelligence: http://www.microsoft.com/bi/ • SharePoint 2010 site: http://sharepoint.microsoft.com • SharePoint Team Blog: http://blogs.msdn.com/sharepoint/default.aspx • BI Blog: http://blogs.msdn.com/b/bi/ • From KMA • Webinars, white papers and blogs at www.kma-llc.net
Resources: Mapping • Bing Developer Center & Bing Maps Customer Gallery: • http://www.microsoft.com/maps/developers/ • Bing Maps Blog: • http://www.bing.com/community/blogs/maps/ • GIM International – online magazine of geomatics: • http://www.gim-international.com/index.php
Resources: Pivot • Microsoft Live Labs Pivot site • http://www.getpivot.com/ • Pivot Viewer control for Silverlight: • http://www.silverlight.net/learn/pivotviewer/ • Pivot Collection Gallery: http://www.getpivot.com/collections/
Questions? • Evaluations • Contact Me • Ask the Experts • Prizes!
Thank you… • Contact Details • Email cmcnulty@kma-llc.net • Blog http://blogs.kma-llc.net/microknowledge • Twitter: http://twitter.com/cmcnulty2000 • LinkedIn:http://www.linkedin.com/in/cmcnulty