Download
1 / 19
190 likes | 310 Views
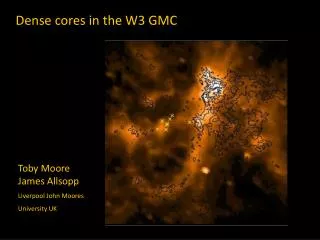
Dense cores in the W3 GMC. Toby Moore James Allsopp Liverpool John Moores University UK. 850 um continuum. 850 um continuum. 850- μ m clumps in the W3 GMC. 319 dense clumps found above the noise contamination limit ( 280mJy ̴ 13 M )

E N D
Dense cores in the W3 GMC Toby Moore James Allsopp Liverpool John Moores University UK
850-μm clumps in the W3 GMC • 319 dense clumps found above the noise contamination limit (280mJy ̴13 M) (20K thermal Jeans mass of source just filling beam ~1 M) • 86% by mass, 69% by number of clumps are in the compressed cloud layer
W3: Mass fraction in dense clumps • Compressed layer total mass = 1.5 x 10⁵ M • dense clump total mass = 3.8 x 10⁴ M • dense clump mass fraction = 26% • extrapolating the mass function: <37% • Diffuse Cloud gas mass (SCUBA survey region) = 1.15 x 10⁵ M • dense clump total mass = 6.1 x 10³ M • dense clump mass fraction = 5% (13%) • No significant difference in clump mass function (Moore et al 2007)
Implications of sub-mm results • Dense, star-forming structures forming more efficiently in the interaction region • Spitzer data: no significant difference in fraction of clumps with IR detections (Polychroni et al 2010) • Simple triggering by collect and collapse only. • But the clump mass fraction is (1/Mcloud) ʃ ṁclumpdt • And is the triggering mechanism affecting the physical state of the cores?
NH3 observations Observed 65 clumps in NH3 (1,1) and (2,2) with GBT 60 detected Measured ΔV Derived Tex &Tkin Use Tkin for Tdustto get clump mass M from 850-μm flux Hence Mach no. & virial ratio (M/Mvir)
NH3 parameter distributions Tex ΔV Mach no. Tkin
What does it mean? • Low beam filling factors in W3 Main (plus the tail of low virial ratio sources) suggests the W3 regional differences may be due to more evolved sources in compressed region (cfFeigelson & Townsley 2008) • or strongerfeedback from higher-mass sourceswithin the larger “triggered” sample