Understanding ASTM C-33 Aggregate Gradation for Septic Drainfield Applications
140 likes | 415 Views
This guide offers a comprehensive overview of ASTM C-33 gradation tables, focusing on aggregate size numbers crucial for septic drainfield construction. It explains how size numbers dictate the sieves used to test aggregate quality, detailing gradation requirements for coarse aggregates. The document illustrates acceptable ranges of cumulative percentages passing various sieve sizes, ensuring compliance with Florida's standards. By analyzing table data and graphs, contractors can determine the predominant size and uniformity of aggregates in their samples, aiding construction effectiveness and regulatory adherence.

Understanding ASTM C-33 Aggregate Gradation for Septic Drainfield Applications
E N D
Presentation Transcript
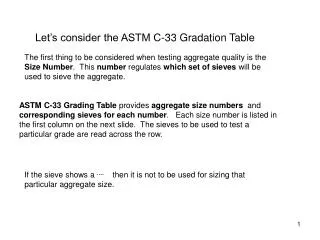
Let’s consider the ASTM C-33 Gradation Table The first thing to be considered when testing aggregate quality is the Size Number. This number regulates which set of sieves will be used to sieve the aggregate. ASTM C-33 Grading Table provides aggregate size numbers and corresponding sieves for each number. Each size number is listed in the first column on the next slide. The sieves to be used to test a particular grade are read across the row. If the sieve shows a….then it is not to be used for sizing that particular aggregate size.
Grading Requirements for Coarse Aggregates Amounts Finer than each Laboratory Sieve (Square Openings) Cumulative Weight Percent Size # Nominal Sieves w/sq openings 4” 100 mm 3½” 90 mm 3” 75 mm 2½” 63 mm 2” 50 mm 1½” 37.5 mm 1” 25 mm 3/4” 19 mm 1/2” 12.5 mm 3/8” 9.5 mm No.4 4.75 mm No.8 2.36 mm 1 3½” to 1½” 90 to 37.5 mm 100 90 to100 …. 25 to 60 …. 0 to 15 …. 0 to 5 …. …. …. …. 2 2 ½” to 1 ½” 63 to 37.5 mm …. …. 100 90 to 100 35 to 70 0 to 15 …. 0 to 5 …. …. …. …. 3 2” to 1” 50 to 25 mm …. …. …. 100 90 to 100 35 to 70 0 to 15 …. 0 to 5 …. …. …. 357 2” to #4 50 to 4.75 mm …. …. …. 100 95 to 100 …. 35 to 70 …. 10 to 30 …. 0 to 5 …. 4 1½” to 3/4” 37.5 to 19 mm …. .... .... …. 100 90 to 100 20 to 55 0 to 15 …. 0 to 5 …. …. 467 1 ½” to #4 37.5 to 4.75 mm …. .... .... …. 100 95 to 100 …. 35 to 70 …. 10 to 30 0 to 5 …. 5 1” to 1/2” 25 to 12.5 mm …. .... .... …. …. 100 90 to 100 20 to 55 0 to 10 0 to 5 …. …. 56 1” to 3/8” 25 to 9.5 mm …. .... .... …. …. 100 90 to 100 40 to 85 10 to 40 0 to 15 0 to 5 …. 57 1” to #4 25 to 4.75 mm …. .... .... …. …. 100 95 to 100 …. 25 to 60 …. 0 to 10 0 to 5 6 3/4” to 3/8” 19.0 to 9.5 mm …. …. …. …. …. …. 100 90 to 100 20 to 55 0 to 15 0 to 5 …. 67 3/4” to #4 19 to 4.75 mm …. …. …. …. …. …. 100 90 to 100 …. 20 to 55 0 to 10 0 to 5 7 1/2” to #4 12.5 to 4.75 mm …. …. …. …. …. …. …. 100 40 to 70 0 to 15 0 to 5 90 to 100 …. 8 3/8” to #8 9.5 to 2.36 mm …. …. …. …. …. …. …. 100 85 to 100 10 to 30 0 to 10 0 to 5
Aggregate SIZE NUMBERSInformation Overview • Size # 1-8 • The higher the number, the smaller the aggregate size (this is the opposite of shoe sizes) • Table gives % variation on each sieve used • Most material is found on the sieve with widest range in % s • Single digit size numbers are uniform (for example #4) • 2nd & 3rd digit (as in #357) widens the range of acceptable particle sizes • Plotted as Cumulative % finer by weight versus sieve size • Begins in upper left at 100%, ends in lower right close to 0% • Large drop means most material of that particle size • Vertical drop means uniform particle size • Graded drop means mixture of various particles –called non uniform. • Clean material (with few fines) end in lower right of graph near X axis (close to 0%) In the following pages we will examine each aggregate size listing that is useful for septic drainfields. By examining the table and the graph we will be able to determine the predominate size, uniformity, and percent of fine particles in an aggregate sample.
The previous chart includes all coarse aggregate. On the following slides we will take a closer look at the specific aggregate sizes that affect Septic contractors. DOT Sizes; 357,4, 467 & 5 always fall in the Gradation Range appropriate for septic drainfields in Florida. DOT Sizes 3, 56, & 57 sometimes fall in this range, but not always. Sieve Size Cum. % Passing Gradation Requirements for the state of Florida 2” 90- 100% In addition, the state standardallows no more than 3.75%by weight to pass the No. 200 sieve (dust-sized particles) 1½” 35-100% 1” 15-100% 3/4” 0-70% 1/2” 0-50% 3/8” 0-30% No. 4 0-5%
Gradation Requirement Sieve Size Cum. % Passing In addition, the state standardallows no more than 3.75%by weight finer than the No. 200sieve (dust-sized particles) 2” 90- 100% 1½” 35-100% 1” 15-100% 3/4” 0-70% 1/2” 0-50% 3/8” 0-30% No. 4 0-5% Cumulative % finer by weight minimum) Cumulative % finer by weight (maximum) The shaded area in between the minimum & maximum cumulative % finer by weight, represents the acceptable range for aggregate in drainfields. This is a wider range than any of the DOT sizes.
Gradation Requirement Sieve Size Cum. % Passing 2” 90- 100% 1½” 35-100% 1” 15-100% 3/4” 0-70% smaller 1/2” 0-50% 3/8” 0-30% No. 4 0-5% Larger Any points found to the LEFT of the green line; the aggregate would be too large. Likewise any point found to the right of the red line; the aggregate would be too small for drainfields.
Let’s take a closer look at one specific DOT size. DOT # 3 DOT Size # Nominal Size Sieves w/sq openings 4” 100mm 3 ½” 90 mm 3” 75mm 2 ½” 63mm 2” 50mm 1 ½” 37.5mm 1” 25mm 3/4” 19mm 1/2” 12.5mm 3/8” 9.5mm No.4 4.75mm No.8 2.36mm 2” to 1” 50 to 25 mm 3 …. …. …. 100 90 to100 35 to 70 0 to 15 …. 0 to 5 …. …. …. Reading across the row you can see that the 2½”, 2”,1 ½”, 1”, and the 1/2” sieves would be used and stacked in order as shown below. Stacked with the largest square openings on the top to progressively smaller openings and a pan to catch fine material.
Graphed DOT # 3 would look like this. Represents cumulative % finer by weight (maximum) Represents cumulative % finer by weight (minimum) DOT Size # Nominal Size Sieves w/sq openings 4” 100mm 3 ½” 90 mm 3” 75mm 2 ½” 63mm 2” 50mm 1 ½” 37.5mm 1” 25mm 3/4” 19mm 1/2” 12.5mm 3/8” 9.5mm No.4 4.75mm No.8 2.36mm 2” to 1” 50 to 25 mm 3 100 90 to100 35 to 70 0 to 15 0 to 5 …. …. …. …. …. …. …. Y Y Axis = Cumulative % of material that falls through the sieve. 100__ 80__ X Axis= Sieve square opening size. 60__ Notice at the 2½” sieve 100% of the material will fall through the sieve. 0% will remain on the sieve. 40__ 20__ At 2”90 to 100% will fall through. 0% to 10% may remain on the sieve. 0__ X ½” 2½” 2” 1½” 1”
Graphed DOT # 3 would look like this. Represents cumulative % finer by weight (maximum) Represents cumulative % finer by weight (minimum) DOT Size # Nominal Size Sieves w/sq openings 4” 100mm 3 ½” 90 mm 3” 75mm 2 ½” 63mm 2” 50mm 1 ½” 37.5mm 1” 25mm 3/4” 19mm 1/2” 12.5mm 3/8” 9.5mm No.4 4.75mm No.8 2.36mm 2” to 1”50 to 25 mm 3 100 90 to100 35 to 70 0 to 15 0 to 5 …. …. …. …. …. …. …. 100__ 80__ At 1½” the minimum cumulative finer by weight is 35% & 70% is the maximum that can fall through. Conversely as much as 65% may remain on this sieve and the two above it, or as little as 30% may remain on this sieve or the ones above it. 60__ 40__ 20__ 0__ ½” 2½” 2” 1½” 1”
Graphed DOT # 3 would look like this. Represents cumulative % finer by weight (maximum) Represents cumulative % finer by weight (minimum) DOT Size # Nominal Size Sieves w/sq openings 4” 100mm 3 ½” 90 mm 3” 75mm 2 ½” 63mm 2” 50mm 1 ½” 37.5mm 1” 25mm 3/4” 19mm 1/2” 12.5mm 3/8” 9.5mm No.4 4.75mm No.8 2.36mm 2” to 1” 50 to 25 mm 3 100 90 to100 35 to 70 0 to 15 0 to 5 …. …. …. …. …. …. …. At 1” the maximum finer by weight is 15%. This means 85% will be on this sieve or the sieves above it. The minimum finer by weight is 0% therefore all of the material could be on this sieve & the sieves above it. 100__ 80__ 60__ 40__ At 1/2” the maximum finer by weight is 5% and the minimum is 0%. So as much as 100% or as little as 95% could be on or above this sieve 20__ 0__ ½” 2½” 2” 1½” 1”
Graphed DOT # 3 would look like this. Represents cumulative % finer by weight (maximum) Represents cumulative % finer by weight (minimum) DOT Size # Nominal Size Sieves w/sq openings 4” 100mm 3 ½” 90 mm 3” 75mm 2 ½” 63mm 2” 50mm 1 ½” 37.5mm 1” 25mm 3/4” 19mm 1/2” 12.5mm 3/8” 9.5mm No.4 4.75mm No.8 2.36mm 2” to 1” 50 to 25 mm 3 100 90 to100 35 to 70 0 to 15 0 to 5 …. …. …. …. …. …. …. Now that we have all of the maximum & minimum cumulative finer by weights plotted, the points may be connected. 100__ 80__ 60__ The green & red lines represent the minimum & the maximum cumulative finer by weight percents. All of the area in between the lines is in an acceptable range. If any data points fall to either side of the polygon then the test sample is not DOT #3. 40__ 20__ 0__ ½” 2½” 2” 1½” 1”
Graphed DOT # 3 would look like this. Represents cumulative % finer by weight (maximum) Represents cumulative % finer by weight (minimum) DOT Size # Nominal Size Sieves w/sq openings 4” 100mm 3 ½” 90 mm 3” 75mm 2 ½” 63mm 2” 50mm 1 ½” 37.5mm 1” 25mm 3/4” 19mm 1/2” 12.5mm 3/8” 9.5mm No.4 4.75mm No.8 2.36mm 2” to 1” 50 to 25 mm 3 100 90 to100 35 to 70 0 to 15 0 to 5 …. …. …. …. …. …. …. You will notice on the graph that the 1 ½” sieve is where there is the steepest drop. And in the table it has the broadest range (35 to 70). This is the size range of most of the aggregate material. Therefore 1½” is the Predominate Size of this sample. 100__ 80__ 60__ 40__ 20__ The prefix “uni” means one. If a large portion of the aggregate remains on one screen then the sample is uniform size. 0__ ½” 2½” 2” 1½” 1”
Gradation Standard (blue line) DOT #3 Inspect this graph carefully. The blue line represents the gradation requirements for the State of Florida drainfield aggregate. The red & green lines represent cumulative percent by weightmaximum & minimums we just plotted. Notice that part of the green line extends to the left of the state requirements. This means that sometimes #3 aggregate will be too large for state standards. A small size #3 would fit state standards.
Graphed DOT # 3 would look like this. Represents cumulative % finer by weight (maximum) Represents cumulative % finer by weight (minimum) DOT Size # Nominal Size Sieves w/sq openings 4” 100mm 3 ½” 90 mm 3” 75mm 2 ½” 63mm 2” 50mm 1 ½” 37.5mm 1” 25mm 3/4” 19mm 1/2” 12.5mm 3/8” 9.5mm No.4 4.75mm No.8 2.36mm 2” to 1” 50 to 25 mm 3 100 90 to100 35 to 70 0 to 15 0 to 5 …. …. …. …. …. …. …. 100__ The amount of fine particles can be determined by looking at the graph. The closer the polygon is to the x axis the less fine material is included in the sample. 80__ 60__ 40__ 20__ 0__ ½” 2½” 2” 1½” 1”