Download
1 / 33
360 likes | 570 Views
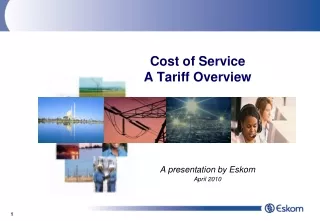
Cost of Service A Tariff Overview. A presentation by Eskom April 2010. Purpose of the presentation. Provide a background on the Eskom standard tariffs Background and context of industry Strategic pricing direction & tariff design principles Steps to determine tariffs

E N D
Cost of ServiceA Tariff Overview A presentation by Eskom April 2010
Purpose of the presentation • Provide a background on the Eskom standard tariffs • Background and context of industry • Strategic pricing direction & tariff design principles • Steps to determine tariffs • Cross-subsidies in the Eskom tariffs • Eskom standard tariff options
The Electricity Supply Chain Transmission Substation Transmission Lines (400/275 kV) Electricity Generation Distribution Lines Distribution Substation Reticulation HV Line (11 & 22kV) Residential Reticulation LV Line (380/220V) POWER STATIONS Industry, Mining & Large Metros Commercial/Small industry/ Farming/Small Munics
The cost of electricity R. Electricity generation Assets, auxiliary consumption, returns, opex and technical losses + R. Transmission at high voltages Assets, ancillary services, lines, returns, opex and technical losses + R. Distribution to supplies at medium to lower voltages Assets, lines, returns, opex and technical losses + R. Administration and billing (service) R. NERSA approved revenue for recovery from tariffs 5
The NERSA allowed average electricity costs 2009/10 break-down 24.3c/kWh Generation 75% Environmental levy 1.8c/kWh 6% Transmission networks 0.7c/kWh 2% Total 41.6c/kWh in 2010/11 Distribution networks 5.3c/kWh 16% Service 0.4c/kWh 1% Connection charges • Notes: • Update to 2010/11 once the NERSA allowed revenue splits by division are obtained. • Levy at 1.8c/kWh as this is annual average. Levy only effective as of 1 July i.e. 9 months of financial year. 0.1c/kWh 0.3% Total average 33c/kWh 100% 6
Electricity consumption Percentage of sales in kilowatt-hours by consumers served Of the total Eskom electricity sales, Residential consumers represent 5%.
Objectives of pricing • Cost reflectiveness vs Affordability • Subsidies • Appropriate Structure vs Simplicity • Metering costs • Customer Comprehension • Cost based signal vs. Elasticity of Demand • These objectives are in conflict and it requires an optimisation process to balance the objectives
Strategic pricing direction for tariff structures OBJECTIVES • Economic efficiency and sustainability: tariffs will contain cost-reflective signals that promote economic efficiency and sustainability. • Revenue recovery: tariff structures will not expose Eskom to unacceptable revenue risk and provide the means for adequate revenue recovery to ensure reliability of supply. • Fairness and equity: tariffs will be designed to be as non-discriminatory as possible by taking into account the needs of all customers on a fair and equitable basis.
How does Eskom design tariffs? • Based on the cost of supply • Design the structures to reflect cost drivers • Includes approved cross-subsidies • Has to submit changes to NERSA for approval • Has to comply with the requirements of the MFMA to make changes to municipal tariffs
Standard tariffs framework Corporate Finance Multi-year Price Determination (MYPD) Revenue Requirement Average price levels Local NPAs Electricity pricing Standard tariffs Structures of individual tariffs Tariff levels relative to each other Cross-Subsidies Simplicity
Cost of supply studyMethodology Costs segmented into appropriate categories and allocated to customers in that category. • Methodology that allocates the approved revenue requirement (costs) into different and unbundled cost categories. • Use of the most appropriate cost driver for a particular cost i.e. R/customer/month or R/customer/day charge - typically for customer service and administration costs; R/kVA - typically for network costs; R/kW - typically for network or some energy related costs; Energy loss factors for energy loss costs.
Cost of supply Costs below derived from the NERSA approved revenue requirement including allowed return on assets (may not therefore reflect true cost) Cost of supply impacted by …….. • Energy cost • Cost of generating electricity, including the costs of the power station, the fuel and water • This will include Eskom generation and any energy purchased by Eskom • Transmission costs • Cost of Eskom Transmission Division, including costs of network > 132 kV including the costs of capital, operations, maintenance, refurbishment and ancillary services • Distribution costs • Cost of Eskom Distribution division split between network and retail (customer service and administration) costs. • The network costs include capital, operations, maintenance and refurbishment. • Retail costs cover the cost of metering, billing, administration and customer services. Load profile and voltage Transmission zone and capacity Voltage and capacity Size of the customer 14
What is cost reflective tariffs? • Each customer class pays a tariff that is closely aligned with the cost of providing supply to that particular customer class.
Tariff structures in electricity A cost reflective tariff structure to recover electricity costs will typically contain: • A signal to reflect time and seasonal variance of the cost of energy. • The network costs. • Differentiation to take into account: • The voltage of the supply. • The electrical (technical) losses. • Reactive energy support. • The density of the network to which customers are connected. • The load factor/profile. • Retail charges that reflect the size of the supply and the services being provided to the customer.
Not all tariffs can be cost reflective! • Once a cost reflective tariff is calculated, tariff simplicity and affordability considerations are to be taken into account for the design of the final tariff to be applied • Subsidies in electricity tariffs affect the tariff applied. • Have inter-tariff subsidies where one tariff subsidises another tariff • Based on socio-economic considerations driven by Government
Tariffs should recover Total Cost to Supply including Regulated Return but Total Eskom Tariff Income = Total Eskom Cost to Supply Individual Tariff Income ≠ Individual Tariff Cost Subsidy Levy Total Eskom Cost to Supply(Allowed Revenue) Total Eskom Tariff Income Levy Subs Cost Revenue Revenue Cost Revenue Cost Revenue Cost Revenue Cost Cost Revenue Tariff 1 Tariff 2 Tariff 3 Tariff 4 Tariff 5 Tariff x
2009/10 Electricity price subsidies Per sector averages (irrespective of tariff used) • Industrial and Mining supplies contribute 3c/kWh subsidy to residential consumers. • Residential, Agricultural consumers directly supplied by Eskom receive 21c/kWh discount in the tariffs i.e. R3billion for 2009/10 mainly paid for by industrial and mining consumers. • Larger Municipalities contribute 2c/kWh to smaller and rural municipalities through their Eskom tariffs. 21
Cross-subsidies in the Non-Local Authority tariffs, 2010/11. • Two types of NERSA approved subsidies i.e. network subsidy and price increase subsidy: • Network subsidies paid for by the local authority and non-local authority tariffs. • Price increase subsidy i.e. past lower increases residential tariffs and from implementing the inclining block rates. 22
Eskom tariffs • The Eskom tariffs are cost reflective; the tariff charges are calculated to demonstrate the level and how costs are incurred in delivering electricity to end-customers. • The level of the tariff charges are determined by the NERSA as they only recover the NERSA approved costs. • The price paid by consumers is determined by: • the amount of electricity consumed (per kilowatt-hour); • the cost of transporting it (network lines and transformation assets); and • services to avail the electricity to the consumer (customer services). • Therefore, the sector in which a consumer belongs is not used to determine the price paid for electricity. • The NERSA can determine a lower price for tariffs used by particular sectors e.g. lower increase to Homelight tariffs (residential) in 2008/9 and 2009/10.
Eskom’s standard tariffs Urban Rural Urban tariff categories: Rural tariff categories: Residential tariff categories:
Why so many tariffs? Optimisation/ Balance • Meet diverse customer needs. • Cost-Reflectiveness • Complexity vs. Metering costs • Different objectives for different customer groups • Pricing signal to change behaviour. • Allowing for certain customer categories to be subsidised
What balance do we try to achieve ? • International precedents • Cost reflectiveness • Fairness to customers • Implementable and sustainable • Complexity • Administrative burden • Pricing signal for efficiency • Customer response • Affordability • Stimulate growth • Competitiveness with other energies • Revenue impact to utility • Consistency across tariffs/customers
Selection of Tariffs • No option is right or wrong • Each has its own implications, advantages & disadvantages • Final selection • Judgement • Best compromise
Tariff options structures Most of the electricity sales from tariffs on the Time-of-use (TOU) structures 31
International Price Comparison of Industrial Tariffs (Indicative) 30 25 20 US cents/ kWh 15 10 5 0 UK Italy India USA China Spain Japan Korea Brazil Ireland Turkey Poland France Finland Greece Norway Mexico Canada Hungary Portugal Denmark Malaysia Germany Singapore Switzerland South Africa New Zealand RSA 2012/13 Czech Republic Source : Recent NUS Survey Analysis assumes R/$ exchange rate remains constant and electricity prices of other countries do not increase in real terms Despite the steep tariff adjustments South Africa will remain competitive.
The End 33