Download

1 / 26
260 likes | 481 Views
De Anza College 2009 Community College Survey of Student Engagement. Presented to the Academic Senate January 10, 2011 Prepared by Mallory Newell Institutional Research and Planning, De Anza College. CCSSE Overview .

E N D
De Anza College 2009 Community College Survey of Student Engagement Presented to the Academic Senate January 10, 2011 Prepared by Mallory Newell Institutional Research and Planning, De Anza College
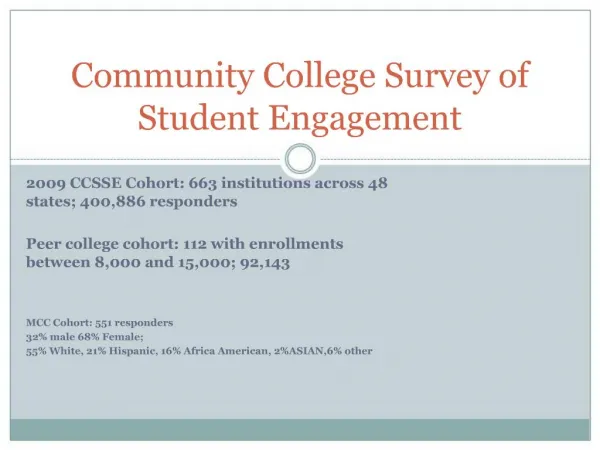
CCSSE Overview • The Community College Survey of Student Engagement (CCSSE) was developed to: • provide information about effective educational practices in community colleges, • and to assist those colleges in using the information to promote improvements in student learning and persistence. • The survey focuses on student engagement – the amount of time and energy that students invest in meaningful educational practices.
CCSSE Overview - continued • Survey questions cover: • Active and Collaborative Learning • Student Effort • Academic Challenge • Student-Faculty Interaction • Support for Learners
CCSSE Overview - continued • Student background questions include: • Educational goal • How students pay for college • Grade point average • Day/evening course taking • Total credits taken • Number of courses taken • Marital status, children • English as native language • Educational attainment • Parent’s educational attainment
Survey Sample • The 2009 survey was administered in class during the spring 2009 quarter. • 76 course sections were randomly selected by CCSSE in which 34 sections chose to participate, which resulted in 797 of 2,411 valid survey responses, yielding a response rate of 33%.
Survey Sample – Breakdown • Gender: • Male – 46% (49% in DA total student population) • Female – 54% (51%) • Ethnicity: • White – 26% (24%) • Asian – 35% (37%) • Black – 3% (6%) • Hispanic – 12% (17%) • American Indian – 1% (1%) • Other – 6% (10%) • International Students – 18% (6%)
Survey Sample – Breakdown • Age • 18-21 – 50% (46% in DA total student population) • 22-24 – 13% (15%) • 25-39 – 23% (25%) • 40 and over – 14% (12%) • Enrollment Status: • Part-time – 32% (61%) • Full-time – 68% (39%)
Comparisons • The following slides compare items that were selected based on the data available in the 2007 survey for comparison purposes. • The 2007 survey was administered in spring quarter of 2007 to a random sample of 57 class sections, which resulted in 1,172 of 2,057 valid survey responses from 48 sections and yielded a response rate of 57%.
Which of the following have you done, are you doing, or do you plan to do while attending this college? - College Orientation
How satisfied are you with the academic advising and planning services?
How much does this college emphasize providing the support you need to help you succeed at this college?
About how many hours do you spend per week participating in college-sponsored activities (organizations, campus publications, student government, intercollegiate or intramural sports, etc.)
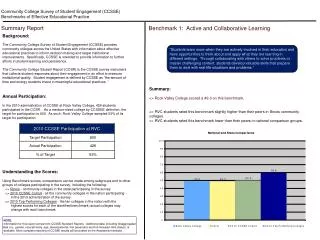
Benchmark Report • This report highlights De Anza College’s results compared to the CCSSE Cohort (663 colleges and 400,886 student respondents) and the extra large colleges cohort (58 colleges and 15,000 students) in the “benchmark” areas. • “Benchmarks” are groups of conceptually related items that address key areas of student engagement, learning and persistence that educational research has shown to be important in high-quality educational practice. • The benchmarks can be used to compare college performance across benchmarks to similarly sized institutions and the total CCSSE population.
De Anza College
Mean Scores • The mean scores report provides item-by-item means for all valid responses at De Anza (N= 797) compared to a comparison group of other SSPIRE Consortium colleges (N= 7,128) and the 2009 CCSSE Cohort (students who participated in CCSSE from 2007-2009, N = 40,089). • The SSPIRE Consortium was launched in 2006 and is supported by the James Irvine Foundation. It includes nine California community colleges that work to raise academic achievement, persistence rates and degree completion among low-income, underprepared and traditionally underserved students.
Mean Scores – Summary • De Anza College is above the mean of other SSPIRE Consortium colleges in: • Made a class presentation* • Number of written papers or reports of any length* • Preparing for class (studying, reading, writing, rehearsing, doing homework or other activities related to your program)* • Total number of credit hours earned at this college (15-29 units) not counting the courses you are currently taking this term* *statistically significant differences between the means
Mean Scores - Summary • De Anza College is below the mean of other SSPIRE Consortium colleges in: • Providing the financial support you need to afford your education* • Working for pay (6-10 hours per week)* • Satisfaction with academic advising* • Satisfaction with career counseling* • Frequency of use of career counseling* • Frequency of use of financial aid advising* • Importance of financial aid advising* *statistically significant differences between the means
Comparison of Means • The following tables compare the 2007 mean scores (N= 1,097) to the 2009 mean scores (N= 797) of selected questions.
Active and Collaborative LearningIn your experiences at De Anza during the current school year, about how often have you done each of the following?
Student EffortIn your experiences at De Anza during the current school year, about how often/much have you done/used each of the following?
Academic ChallengeIn your experiences at De Anza during the current school year, about how often/much have you done/used each of the following? How much does De Anza college emphasize the following? Encouraging you to spend significant amounts of time studying 2.95 2.94 -0.01 1= very little, 2= some, 3= quite a bit, 4= very much
Student-Faculty InteractionIn your experiences at De Anza during the current school year, about how often have you done each of the following?
Support for LearnersHow much does De Anza College emphasize the following? How often do you use each of the following services?
Conclusions • Overall, the results from the comparison show that De Anza has improved from 2007 to 2009. • Areas in which De Anza has improved include Academic and Collaborative Learning, Student Effort and Academic Challenge. • Areas in which De Anza could benefit by focusing more heavily include Student-Faculty Interaction and Support for Learners. • It seems that De Anza continues to score low in the areas of providing financial aid advising and support as well as academic and career advising and support.
This presentation is available on the De Anza Research website at www.deanza.edu/ir/ • Additional documents for analysis are available upon request.