Download
1 / 33
330 likes | 443 Views
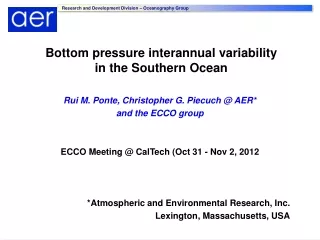
May 19-21, 2008. Factors that influence the interannual variability of hurricane frequency in the NE Pacific. Dr. Jennifer Collins Geography Department USF. jcollins@cas.usf.edu. The NE Pacific and Atlantic hurricane link. Dr. Jennifer Collins Geography Department USF.

E N D
May 19-21, 2008 Factors that influence the interannual variability of hurricane frequency in the NE Pacific Dr. Jennifer Collins Geography Department USF jcollins@cas.usf.edu
The NE Pacific and Atlantic hurricane link Dr. Jennifer Collins Geography Department USF jcollins@cas.usf.edu
Outline • Other ocean basins besides the North Atlantic • Sub-dividing the ocean basin for the analysis • Dynamic vs. thermodynamic local variables • Influence of ENSO? • Other non-local influences? • Examine the relationship between N. Atlantic and NE Pacific frequency of tropical cyclones
Why study the Northeast Pacific? • High frequency of hurricanes
Why study the Northeast Pacific? • High frequency of hurricanes • May hit US or Mexico • Hurricane Dora threatened Johnston Island, 1999 • Intense hurricanes in season prior to the start of this work
Why study the Northeast Pacific? • High frequency of hurricanes • May hit US or Mexico • Hurricane Dora threatened Johnston Island, 1999 • Intense hurricanes in season prior to PhD • Little published research
Why study variability of numbers from year to year? • NE Pacific number of storms 1992 – 27 1977 – 8 • Forecasting potential
Location of NE Pacific hurricanes WDR: Western Development Region 1983 season WDR EDR EDR: Eastern Development Region 1994 season WDR EDR
Gray’s six factors necessary for tropical cyclone formation 1/ Coriolis Force is sufficient to give initial cyclonic spin 2/ Low vertical windshear 3/ Sufficient amount of pre-existing low level vorticity 4/ high values of mid-tropospheric relative humidity 5/ SST > 26-27 oC to a depth of 60 m. 6/ Environmental lapse rate should be steep enough to allow free convection
Methodology • Statistical study - Using the deviance test
Relationships between hurricane frequency and the environmental variables (Reduction in deviance shown) VariableWDREDR Relative Humidity 20.65 1.56 Sea Surface Temp. 13.98 1.72 Precipitable Water 18.36 1.92 Upward Longwave Radiation Flux 13.48 1.00 Relative Vorticity 3.13 1.15 Wind Shear 3.46 0.39 ENSO (kw index) 6.28 0.83 (SOI) 10.48 1.15 (Nino1) 3.76 1.50 (Nino2) 3.84 0.91 (Nino3) 3.27 0.50 (Nino4) 12.40 1.62 QBO 1.25 1.09
Relative humidity (RH) and sea surface temperature (SST) for active hurricane years (black) and inactive hurricane years (green). Environmental variables are averaged over latitudes 10°N to 20 °N
Wind shear (200 mb to 850 mb) for active hurricane years (black) and inactive hurricane years (green). Wind shear (m/s) Wind shear values are averaged over latitudes 10°N to 20 °N
Relative humidity (RH) differences between the 5 most and 5 least active hurricane years in the western development region -10 15 low RH difference(%) high nb. White box is the western development region
Sea surface temperature (SST) differences between the 5 most and 5 least active hurricane years in the western development region -0.8 0.8 low SST difference high nb. White box is the western development region
Relative Humidity • What causes relative humidity to vary from year to year?
Relative humidity in active and inactive hurricane years 11 66 11 66 low high low RH (%) high RH (%) Active hurricane years Inactive hurricane years
Relative Humidity • What causes relative humidity to vary from year to year?
Sea surface temperature and surface winds at 10 meters in warm and cold ENSO years 20 28 20 28 low SST high low SST high Six warmest ENSO years Six coldest ENSO years
Mid-tropospheric relative humidity and surface winds at 10 meters in warm and cold ENSO years 11 66 11 66 RH (%) low high low RH (%) high Six warmest ENSO years Six coldest ENSO years
Relative Humidity • What causes relative humidity to vary from year to year? and …
Relative Humidity • What causes relative humidity to vary from year to year? and … a thermal low pressure centered at 30oN and -112.5oW?
Climatology of pressure (mean sea level) 1009.2 1013.5 1009.2 1013.5 Pressure (mb) Pressure (mb) 1991 1995 nb. Pressure values are averaged over July-September season
Relative humidity Six deepest thermal low years Six shallowest thermal low years 11 66 11 66 Relative humidity (%) Relative humidity (%) nb. Values are averaged over July-September
Surface wind differences in the six deepest minus six shallowest thermal low years (wind anomalies shown). Low High nb. Values are averaged over July-September.
Lower relative humidity in the western development region due to increased subsidence Increased subsidence causes inversion layer to drop and shift south simultaneously. This lowers the relative humidity in the western development region Latitude 10°N 20°N Western development region ITCZ Sub -Tropical High
Relative humidity Six deepest thermal low years Six shallowest thermal low years 11 11 66 66 Relative humidity (%) Relative humidity (%) nb. Values are averaged over July-September
Model to explain relative humidity VariablePercentage of variance explained ENSO 55 Thermal low 42 ENSO + Thermal low 72
Relationships between N. Atlantic tropical cyclones and NE Pacific tropical cyclones (western development region and eastern development region) t-statistics
Conclusions • It is necessary to sub-divide the NE Pacific basin to examine factors that affect hurricane formation • There are strong relationships with thermodynamic factors and hurricane frequency for the WDR • Dynamic factors, important for the Atlantic basin, are not important for the NE Pacific • The strongest relationship is with Relative Humidity • El Nino and the thermal low have a strong influence on the variations of Relative Humidity • There is a negative relationship between hurricane frequency in the NE Pacific and N Atlantic ocean
May 19-21, 2008 Factors that influence the interannual variability of hurricane frequency in the NE Pacific Dr. Jennifer Collins Geography Department USF jcollins@cas.usf.edu www.weathercenter.usf.edu