Download
1 / 24
240 likes | 290 Views
Examples of Accommodation Evaluation with the Tracey 3-D Difference Maps. Tracey Technologies, Corp. Normal Accommodation – 30 Y/O Refraction Map. DISTANCE. NEAR. NEAR. DIFFERENCE. Normal Accommodation 3D Refraction Map (Tilted). DISTANCE. NEAR. DIFFERENCE.

E N D
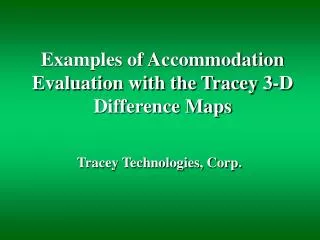
Examples of Accommodation Evaluation with the Tracey 3-D Difference Maps Tracey Technologies, Corp.
Normal Accommodation – 30 Y/O Refraction Map DISTANCE NEAR NEAR DIFFERENCE
Normal Accommodation 3D Refraction Map (Tilted) DISTANCE NEAR DIFFERENCE
Normal Accommodation 3D Refraction Map (Vertical) DISTANCE NEAR DIFFERENCE
Normal Accommodation 3D Refraction Map (Vertical) DISTANCE Hyperopia Mean = +0.4D 1.2D Refractive Range Myopia
Normal Accommodation 3D Refraction Map (Vertical) NEAR Mean = -4.2D 3.5D Refractive Range
Normal Accommodation 3D Refraction Map (Vertical) DIFFERENCE Mean = -4.75D 2.4D Refractive Range
Observations in Normal Accommodation and Near Point Focus • Refraction shifts to More Myopia as Accommodation is defined as a purely Spherical offset • Refractive Range Increases (i.e. More Depth of Field – Psuedo Accommodation)
Monofocal IOL 3D Refraction Map (Vertical) DISTANCE NEAR DIFFERENCE
Monofocal IOL 3D Refraction Map (Vertical) DIFFERENCE No Refractive Difference 0.6D Refractive Range
MONOFOCALPSF @ 33 cm. ACCOMMODATIVE EFFORT DISTANCE NO DIFFERENCE IN PSF
MONOFOCALImage SimulationView @ 33 cm. ACCOMMODATIVE EFFORT DISTANCE NO DIFFERENCE IN IMAGE
Accommodating IOL in Other Eye 3D Refraction Map DISTANCE NEAR DIFFERENCE
Acc. IOL in Other Eye 3D Refraction Map DISTANCE +2.8D 4.1D Refractive Range Mean = +1.6D -1.3D
Acc. IOL in Other Eye 3D Refraction Map NEAR +3.8D Mean = +1.1D 8.6D Refractive Range -4.8D
Acc. IOL in Other Eye 3D Refraction Map DIFFERENCE +1.1D 5.5D Refractive Range Mean = -0.4D -4.5D
Acc. IOLPSF @ 33 cm. ACCOMMODATIVE EFFORT DISTANCE SUBSTANTIAL CHANGE IN PSF
Acc. IOL Image SimulationView @ 33 cm. ACCOMMODATIVE EFFORT DISTANCE SUBSTANTIAL IMPROVEMENT IN NEAR
Acc. IOL 3D Refraction Map DISTANCE NEAR DIFFERENCE
Acc. IOL 3D Refraction Map DISTANCE 2.1D 1.9D Refractive Range Mean =+1.3D 0.2D
Acc. IOL 3D Refraction Map NEAR 2.6D 5D Refractive Range Mean = +1.2D -2.4D
Acc. IOL 3D Refraction Map DIFFERENCE 1.4D Mean = 0.1D 4.2D Refractive Range -2.8D
-3.5D -3.5D Acc. IOL3D Refraction Maps NEAR DISTANCE DIFFERENCE
Summary The Examples above demonstrate that the Tracey 3-D Refraction Maps with Difference Map Objectively quantifies both Accommodation and Psuedo Accomodation Refractive changes in the normal and psuedophakic Eye.