Download
1 / 28
280 likes | 304 Views
Study evaluating genetic improvement effects in pine plantations, showing improved yields and reduced disease incidence. Discover responses to silvicultural treatments and projections for yield prediction.

E N D
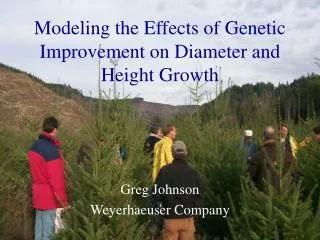
Modeling Effects of Genetic Improvement in Loblolly Pine Plantations Barry D. Shiver Stephen Logan
Modeling Genetic Effects • Plantation Management Research Cooperative (PMRC) established a study in 1986 in the Southeastern USA to evaluate effects of improved genetics on yields from block rather than row plantings • The level of genetic improvement at the time was first generation improvement • Seedlings were planted in January 1987
Study Design • 16 Locations in Piedmont • 15 Locations in Coastal Plain • Six top ranked families in each region chosen to represent single family genetic material • Unimproved seed obtained from region encompassed by study • Bulk lot improved stock obtained by mixing equal amounts of seed from the six selected families in each region
Study Design • Eight 0.4 ac. treatment plots were included at each study installation • For this analysis only treatments one and three are considered (no veg control and no single family)
Measurements • Measurements made at ages 3, 6, 9, 12, 15, and 18 years • All typical measurements made to estimate yields (dbh, total height, etc.) • Overall analysis results show that genetic improvement and vegetation control significantly improve yields and that the effects of the two treatments are largely additive • Genetic improvement reduces fusiform rust incidence by about half • Tree form and percentage of trees qualifying for solid wood are significantly higher for genetically improved plots
Adjusting for Silvicultural Treatments • A common method used by practicing foresters is to adjust the exhibited SI value in an existing growth and yield model • For most silvicultural practices (weed control, fertilization, etc.) this method does not work well because the response is not anamorphic (a proportional (constant %) increase across ages)
Silvicultural Treatment Response • 4 type of silvicultural responses • Type A – growth gains on treated areas continue to increase throughout the rotation. • Type B - growth gains achieved early in rotation are maintained but do not continue to increase after an initial response period. • Type C – early growth gains are subsequently lost. • Type D - growth gains on treated areas fall below levels observed on nontreated areas.
Silvicultural Treatment ResponsePienaar’s Modified Adjustment – Type B Treatment Age, Rmax, and Yst until 90% of max response occurs must be provided by users, so that
Cultural Treatment Response Use Pienaar and Rheney (1995) adjustment function to create C response R = growth response associated with the cultural treatment of interest Yst = years since cultural treatment was applied c = 1/(years to expected maximum response) b = (Maximum response)*c*exp(1)
Type A Response • Creates a response where the gain gets wider as the stand gets older – possibly even anamorphic (stays the same amount larger proportionately as age increases) • Same effect on height as increasing the site index • Would get this with fertilization with P on a P deficient site • Do we get this type response with genetic improvement?
Adjusting for Genetic Improvement • Unlike the majority of silvicultural treatment responses, there is some evidence through age 18 that the genetic treatment response is anamorphic • There is also some evidence that it is primarily effected through a height response • A disturbing finding is the amount of variability in the data – in some cases genetic improvement is negative rather than positive
Structure of our G&Y Models • Models are actually a system of models • H = f (Age, Site) • N = f (Age, Site) • BA = f (Age, H, N) • Y = f (age, H, N, BA) • With our intensive silviculture plots we have found that if we have the basal area per acre and the height correct we can accurately predict the yield (weight/ac)
Basal Area Prediction • The actual observed heights and observed trees per acre were used to estimate basal area per acre using the PMRC basal area prediction equation • Residuals were calculated and graphed • Lack of much of a trend in residuals is an indication that the only factor affecting basal area is change in height
Residual BA using Actual Height on Genetically Improved Plots
Height Residuals for Improved using 10% Adjusted SI for Unimproved at Age 15
Genetically Improved Prediction • Works reasonably well on average • But, lots of variability – on average the improved are higher, but some are even lower • A real problem when trying to predict yields for specific stands • If we have data, we can use projection from existing inventory data in the existing stand
Projection • To evaluate projection, we took the dominant height from the improved plot at age 12 • The projection was done by projecting the dominant height from age 12 to age 18 using the existing equation with no adjustment • The basal area at age 18 was projected from the age 12 existing basal area using the projected dominant height at age 18
Conclusions • Adjusting the site index is a reasonable way to adjust yield models for genetic effects on average • The response does not fit our other response models well except for perhaps a response where the maximum response does not occur until after 18 • There is much variability in such adjustments and the variability increases with age, but appears to be well behaved across the range of site indices • Using actual height data from genetically improved plots at some inventory age and then projecting to an older age shows promise for reducing variability by about half for green weight
Conclusions • In this case each stand has its own adjustment depending on what the dominant height is on the plot at the inventory age – there is no adjustment in the model itself • The residuals found in this study point out just how variable the stands are with very similar inputs (age, site index, tpa, ba)