Question wording and data analysis
Question wording and data analysis. PHC 6716 June 15, 2011 Chris McCarty. Validity and Reliability. Most of what we have dealt with so far has to do with reliability Reliability is the extent to which you will get the same result when you repeat a measure several times

Question wording and data analysis
E N D
Presentation Transcript
Question wording and data analysis PHC 6716 June 15, 2011 Chris McCarty
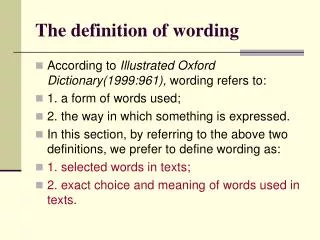
Validity and Reliability • Most of what we have dealt with so far has to do with reliability • Reliability is the extent to which you will get the same result when you repeat a measure several times • Validity is the extent to which you are measuring what you think you are measuring • For example, using frequency of jogging as a measure of exercise is not valid because there are many other forms of exercise • Much of question wording is about validity
Not mutually exclusive • What is your income? • 0-$20,000 • $20,000-$40,000 • $40,000-$60,000 • $60,000-$80,000 • $80,000-$100,000 • $100,000+
Not exhaustive • Where do you get most of your medical advice? • My doctor • TV • Friends • Family members
Too long and wordy • The next questions ask about YOUR OWN health care. Please DO NOT include care you got when you stayed overnight in a hospital or the times you went for dental care visits. For the purposes of this survey a A PERSONAL DOCTOR OR NURSE is the health provider who knows you best. This can be a general doctor, a specialist doctor, a nurse practitioner, or a physician assistant. When you were enrolled in this program or at any time since then, did you get a NEW personal doctor or nurse? • Yes • No
Double-barreled • Please rate your satisfaction with the amount and kind of care you received while you were in the hospital. • Very satisfied • Satisfied • Neither satisfied or dissatisfied • Dissatisfied • Very dissatisfied
Leading • Most doctors believe that exercise is good for you. Do you… • Strongly agree • Agree • Neither agree or disagree • Disagree • Strongly disagree
Unreasonable • How many times in the past year have you eaten out? ________
Too many categories to choose from (will often choose first or last) • Please describe the first page of the web site. • QuitPlan • QuitNet • Quote from member • We're helping Minnesotans learn to quit • Create your own QuitPlan • Ask Questions of Expert Counselors • Get support from the QuitNet community • Learn from science-based Quitting Guides • How much lifetime and money has the Nicodemon stolen from you! • On an average day, how many cigarettes do you (or did you) smoke? • How soon after you wake do you smoke your first cigarette? • QUITPLAN has the tools to help you learn to quit • Other, specify______________________________
Smoking questionUnreasonable for Interviewer • Can you describe what happens in this advertisement? • INT: DO NOT READ CHOICES • 1 They start naming high school clubs and teams that can be joined • 2 Boy names the varsity team • 3 Girl names the drama club • 4 Boy names student government • 5 Girl says, but there is only one with the potential to save over 400,000 • lives every year • 6 Girl says, SWAT • 7 Music starts in background, girls says students working against tobacco • 8 Boy says, we're athletes • 9 Girl says, we're artists • 10 Boy says we're leaders and we are committed to giving Florida's youth a • voice in the fight against tobacco • 11 Girl says, together we can help to stop the tobacco industry and to save • the over 400,000 people who die from tobacco use each year • 12 Girl says, but SWAT needs your help • 13 Boy says, whoever you are • 14 Girl says, whatever you are into. • 15 Boy says, wherever you go to school ask about SWAT and how you can do • your part in the fight against tobacco • 16 Girl says, whatever you do today, can save a life tomorrow • 17 Boy and girls talk about how students have to join to fight against • tobacco • 18 SWAT can fight big tobacco. • 19 Anyone can join SWAT and fight tobacco companies • 20 Tobacco kills people every year. • 21 Don't smoke • 22 Other (Please specify)
Miscellaneous points • When repeating surveys be careful of making changes to response categories such that response numbers mean different things in different versions • Some questionnaire authoring packages allow you to randomize the order of questions, and response categories (Stewart et al) • Alternate questions that are phrased positively and those phrased negatively • Sensitive and controversial questions should be phrased so that respondent feels OK about selecting a negative response • You should typically offer a Don’t Know and Not Available category (Krosnick et al)
Scales • A scale is a set of questions designed to measure a concept that cannot be adequately represented with a single question • There are many existing and tested scales for health care (e.g. Beck depression)
How to create a scale • Begin by getting a group of respondents to free-list questions related to a concept until there are very few new questions • Create a questionnaire using those items • Give the questionnaire to a sample of respondents • Analyze results and remove questions that are overwhelmingly neutral • Test the scale again on a new sample of respondents • High and low values should represent the spectrum of your concept
Indices • Index, like a scale, is a measure derived from a set of questions • The value of an index is in comparing values across time • Consumer confidence index is compared to values from previous month and to same time a year before • Even though questions may not make sense, it is often better to leave an index unchanged for the purposes of comparability
Four levels of measurement • Nominal (categorical, qualitative) • Ordinal (rank) • Interval • Ratio
Nominal Data - Defined • Data represented by number or letters • Data are placeholders for response items – numbers have no numerical meaning • Response items should be mutually exclusive and exhaustive • Typically analyzed with frequencies, crosstabulations and significance tests for crosstabulations such as Chi Square
Nominal - Example • What kind of place do you go to most often when you are sick or need advice about your health? 1 Clinic or health center 2 Doctor's office 3 Hospital emergency room 4 Hospital outpatient department 5 Some other place (Specify) -7 Don't go to one place most often -8 Don't know -9 Refused
Ordinal Data - Defined • Includes the properties of nominal data • Has additional property that numbers have rank order • Often analyzed like nominal data using frequencies and crosstabulations • There are crosstab significance tests for ranked data (Tau B, Gamma), but I rarely see them • Very often they are treated as interval data • They do not have the attributes to be treated as interval data • Some people feel that if they work to predict that is justification for using them as interval data
Ordinal Data - Example • In the last 6 months, not counting times you needed health care right away, how often did you get an appointment for health care as soon as you wanted? 1 Never 2 Sometimes 3 Usually 4 Always
Interval Data - Defined • Has all the properties of nominal and ordinal (place-holding, mutually exclusive and exhaustive, rank order) • Has the additional quality that the distance between numbers is equal • This allows for the calculation of mean and standard deviation • Most of the field of statistics is oriented towards data of at least interval level (e.g. ANOVA, regression, t-test, cluster analysis, etc.) • This makes it extremely tempting to treat ordinal data as interval • There are not a lot of examples of interval data in social science
Interval Data - Example • What is the temperature outside in Fahrenheit? _______
Ratio Data - Defined • Has all the properties of nominal, ordinal and interval (place-holding, mutually exclusive and exhaustive, rank order, equal distance) • Has the additional quality of an absolute zero • There are not many statistics that take advantage of ratio data
Ratio Data - Example • What is your age in years? _____
Interval versus ordinal • Interval data can inadvertently be made ordinal by using bad ranges • You can use midpoint of ranges to make interval • 5 to 9 becomes 7 • 10 or more would typically become 10 In the last 6 months (not counting times you went to an emergency room), how many times did you go to a doctor’s office or clinic to get care for yourself? 0 None 1 1 2 2 3 3 4 4 5 5 to 9 6 10 or more
Open Ended Questions • Typically used when you are unsure what the response categories should be • Sometimes used to provide text examples to illustrate points • Other-Specify is often included as the last of a set of response items to cover unanticipated responses
Open Ended Question – Example 1 • Does your child have any special health care needs? 1 Yes 2 No -8 Don’t know -9 Refused If Yes • What is the diagnosis? ____________________________
Open Ended Question – Example 2 What kind of place do you go to most often when you are sick or need advice about your health? 1 Clinic or health center 2 Doctor's office 3 Hospital emergency room 4 Hospital outpatient department 5 Some other place (Specify) -7 Don't go to one place most often -8 Don't know -9 Refused
Analysis of Open-Ended Questions • Typically researcher reads through all open ended responses and decides if new response categories seem to come up, then recodes open-ended responses to the new categories • Some may used text analysis software (e.g. Atlas.ti, MAXQDA, NVivo)
Wordle of open ended responses to alternative race on ten years of CCI (Brener, et al)
Question placement of breakoffs • Analysis Underway
Question Banks • Pew Research Center • http://people-press.org/question-search/ • Roper Center • http://webapps.ropercenter.uconn.edu/CFIDE/cf/action/catalog/ • Inter-University Consortium for Political and Social Research (ICPSR) • http://www.icpsr.umich.edu/icpsrweb/ICPSR/ • Odum Institute • http://arc.irss.unc.edu/dvn/
Frequency table of nominal variable Respondent's sex Cumulative Cumulative SEX Frequency Percent Frequency Percent ƒƒƒƒƒƒƒƒƒƒƒƒƒƒƒƒƒƒƒƒƒƒƒƒƒƒƒƒƒƒƒƒƒƒƒƒƒƒƒƒƒƒƒƒƒƒƒƒƒƒƒƒƒƒƒƒƒƒƒƒƒ 1,MALE 1106 42.64 1106 42.64 2,FEMALE 1488 57.362594 100.00
Frequency table of ordinal variable Current financial condition Cumulative Cumulative CURFIN Frequency Percent Frequency Percent ƒƒƒƒƒƒƒƒƒƒƒƒƒƒƒƒƒƒƒƒƒƒƒƒƒƒƒƒƒƒƒƒƒƒƒƒƒƒƒƒƒƒƒƒƒƒƒƒƒƒƒƒƒƒƒƒƒƒƒƒƒƒƒƒƒ -9,NA 9 0.35 9 0.35 -8,DK 12 0.46 21 0.81 1,BETTER NOW 1053 40.59 1074 41.40 2,SAME 819 31.57 1893 72.98 3,WORSE NOW 701 27.02 2594 100.0
Crosstabulation EMPLOY(Are you employed now) SEX(Respondent's sex) Frequency‚ Percent ‚ Row Pct ‚ Col Pct ‚1,MALE ‚2,FEMALE‚ Total ƒƒƒƒƒƒƒƒƒˆƒƒƒƒƒƒƒƒˆƒƒƒƒƒƒƒƒˆ -9,NA ‚ 5 ‚ 5 ‚ 10 ‚ 0.19 ‚ 0.19 ‚ 0.39 ‚ 50.00 ‚ 50.00 ‚ ‚ 0.45 ‚ 0.34 ‚ ƒƒƒƒƒƒƒƒƒˆƒƒƒƒƒƒƒƒˆƒƒƒƒƒƒƒƒˆ -8,DK ‚ 6 ‚ 2 ‚ 8 ‚ 0.23 ‚ 0.08 ‚ 0.31 ‚ 75.00 ‚ 25.00 ‚ ‚ 0.54 ‚ 0.13 ‚ ƒƒƒƒƒƒƒƒƒˆƒƒƒƒƒƒƒƒˆƒƒƒƒƒƒƒƒˆ 1,YES ‚ 640 ‚ 712 ‚ 1352 ‚ 24.67 ‚ 27.45 ‚ 52.12 ‚ 47.34 ‚ 52.66 ‚ ‚ 57.87 ‚ 47.85 ‚ ƒƒƒƒƒƒƒƒƒˆƒƒƒƒƒƒƒƒˆƒƒƒƒƒƒƒƒˆ 2,NO ‚ 455 ‚ 769 ‚ 1224 ‚ 17.54 ‚ 29.65 ‚ 47.19 ‚ 37.17 ‚ 62.83 ‚ ‚ 41.14 ‚ 51.68 ‚ ƒƒƒƒƒƒƒƒƒˆƒƒƒƒƒƒƒƒˆƒƒƒƒƒƒƒƒˆ Total 1106 1488 2594 42.64 57.36 100.00
Significance test for a table • Significance test tells you the probability that the relationship you see in the table is due to chance • Significance test does NOT tell you whether the relationship is meaningful • Chi-square is a commonly used significance test for a table • It is very sensitive to the number of cells
Modified crosstabulation EMPLOY(Are you employed now) SEX(Respondent's sex) Frequency‚ Percent ‚ Row Pct ‚ Col Pct ‚1,MALE ‚2,FEMALE‚ Total ƒƒƒƒƒƒƒƒƒˆƒƒƒƒƒƒƒƒˆƒƒƒƒƒƒƒƒˆ 1,YES ‚ 640 ‚ 712 ‚ 1352 ‚ 24.84 ‚ 27.64 ‚ 52.48 ‚ 47.34 ‚ 52.66 ‚ ‚ 58.45 ‚ 48.08 ‚ ƒƒƒƒƒƒƒƒƒˆƒƒƒƒƒƒƒƒˆƒƒƒƒƒƒƒƒˆ 2,NO ‚ 455 ‚ 769 ‚ 1224 ‚ 17.66 ‚ 29.85 ‚ 47.52 ‚ 37.17 ‚ 62.83 ‚ ‚ 41.55 ‚ 51.92 ‚ ƒƒƒƒƒƒƒƒƒˆƒƒƒƒƒƒƒƒˆƒƒƒƒƒƒƒƒˆ Total 1095 1481 2576 42.51 57.49 100.00 Frequency Missing = 18 Statistic DF Value Prob ƒƒƒƒƒƒƒƒƒƒƒƒƒƒƒƒƒƒƒƒƒƒƒƒƒƒƒƒƒƒƒƒƒƒƒƒƒƒƒƒƒƒƒƒƒƒƒƒƒƒƒƒƒƒ Chi-Square 1 27.1563 <.0001 Likelihood Ratio Chi-Square 1 27.2376 <.0001 Continuity Adj. Chi-Square 1 26.7420 <.0001 Mantel-Haenszel Chi-Square 1 27.1458 <.0001 Phi Coefficient 0.1027 Contingency Coefficient 0.1021 Cramer's V 0.1027
Measuring differences between two groups:T-test with insignificant difference Lower CL Upper CL Lower CL Upper CL Variable BLDRO N Mean Mean Mean Std Dev Std Dev Std Dev Std Err PCOUNT 1,OWN 1996 2.4964 2.5556 2.6148 1.3088 1.3494 1.3926 0.0302 PCOUNT 2,RENT 432 2.4348 2.588 2.7411 1.5184 1.6197 1.7355 0.0779 PCOUNT Diff (1-2) -0.178 -0.032 0.1135 1.3629 1.4013 1.4418 0.0744 T-Tests Variable Method Variances DF t Value Pr > |t| PCOUNT Pooled Equal 2426 -0.44 0.6635 PCOUNT Satterthwaite Unequal 567 -0.39 0.6988 Equality of Variances Variable Method Num DF Den DF F Value Pr > F PCOUNT Folded F 431 1995 1.44 <.0001
T-test with significant difference Lower CL Upper CL Lower CL Upper CL Variable SEX N Mean Mean Mean Std Dev Std Dev Std Dev Std Err indexus 1,MALE 1106 92.903 95.242 97.582 38.062 39.648 41.373 1.1922 indexus 2,FEMALE 1488 82.522 84.396 86.27 35.575 36.853 38.227 0.9554 indexus Diff (1-2) 7.8824 10.846 13.81 37.061 38.07 39.135 1.5114 T-Tests Variable Method Variances DF t Value Pr > |t| indexus Pooled Equal 2592 7.18 <.0001 indexus Satterthwaite Unequal 2281 7.10 <.0001 Equality of Variances Variable Method Num DF Den DF F Value Pr > F indexus Folded F 1105 1487 1.16 0.0090
T-test with significant difference Lower CL Upper CL Lower CL Upper CL Variable BLDRO N Mean Mean Mean Std Dev Std Dev Std Dev Std Err indexus 1,OWN 2007 88.335 90.038 91.741 37.734 38.902 40.144 0.8684 indexus 2,RENT 439 81.377 84.912 88.447 35.348 37.687 40.359 1.7987 indexus Diff (1-2) 1.1291 5.1262 9.1233 37.632 38.687 39.803 2.0384 T-Tests Variable Method Variances DF t Value Pr > |t| indexus Pooled Equal 2444 2.51 0.0120 indexus Satterthwaite Unequal 658 2.57 0.0105 Equality of Variances Variable Method Num DF Den DF F Value Pr > F indexus Folded F 2006 438 1.07 0.4071
Means of Persons per household by age group Analysis Variable : PCOUNT Person Count, FL usual residence Broader age group of N respondent Obs N Mean Std Dev Minimum Maximum ƒƒƒƒƒƒƒƒƒƒƒƒƒƒƒƒƒƒƒƒƒƒƒƒƒƒƒƒƒƒƒƒƒƒƒƒƒƒƒƒƒƒƒƒƒƒƒƒƒƒƒƒƒƒƒƒƒƒƒƒƒƒƒƒƒƒƒƒƒƒƒƒƒƒƒƒƒƒƒƒƒƒƒƒƒƒƒƒƒƒ 18-24 161 159 3.2955975 1.5733278 1.0000000 12.0000000 25-34 276 272 3.1985294 1.5620965 1.0000000 16.0000000 35-44 392 388 3.3479381 1.4924689 1.0000000 12.0000000 45-54 511 507 2.7159763 1.2877506 1.0000000 9.0000000 55-64 479 472 2.1440678 1.0033949 1.0000000 7.0000000 >65 722 715 1.8293706 1.2040915 1.0000000 20.0000000 ƒƒƒƒƒƒƒƒƒƒƒƒƒƒƒƒƒƒƒƒƒƒƒƒƒƒƒƒƒƒƒƒƒƒƒƒƒƒƒƒƒƒƒƒƒƒƒƒƒƒƒƒƒƒƒƒƒƒƒƒƒƒƒƒƒƒƒƒƒƒƒƒƒƒƒƒƒƒƒƒƒƒƒƒƒƒƒƒƒƒ