Download

1 / 33
330 likes | 334 Views
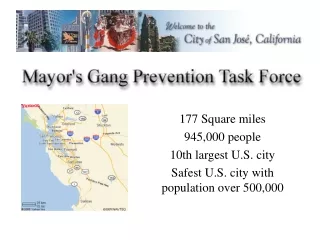
What is Silicon Valley?. 1,800 square miles 40 Cities, 4 counties 2.9 million people, 36 percent foreign born 1.4 million workers 81 percent high school diploma; 43 percent college degree 25 percent of workforce in high-skill occupations Income average 50 percent higher than nation

E N D
What is Silicon Valley? 1,800 square miles 40 Cities, 4 counties 2.9 million people, 36 percent foreign born 1.4 million workers 81 percent high school diploma; 43 percent college degree 25 percent of workforce in high-skill occupations Income average 50 percent higher than nation 8 percent California GDP, 13 percent of US patents Productivity rate growing 50% higher than US average
Silicon Valley: JOBS
Percentage Change 2007 to 2009 SILICON VALLEY: REAL PER CAPITA INCOME Silicon Valley CA U.S. -5.0% -3.6% -3.9%
Silicon Valley, California, US: INCOME DISTRIBUTION
Silicon Valley: OFFICE VACANCY RATES
Silicon Valley: HEALTH INSURANCE COVERAGE
Net Gain of Establishments 2007 - 2008 +9,500 Silicon Valley: BUSINESS ESTABLISHMENTS
HOWEVER: We’re an innovation economy, right?
Silicon Valley: PATENT REGISTRATIONS
Percentage Change 2008 - 2009 Silicon Valley: VENTURE CAPITAL INVESTMENT Silicon Valley U.S. -35% -37%
2009: 55% of California 19% of the United States Silicon Valley: VC INVESTMENT IN CLEANTECH
Silicon Valley: IPOs 2 2008: 1 2009:
Region Lags Behind Other States in Competing for Federal Dollars
Other Regions Are Attracting Federal Dollars for Future Economic Growth
Region Receives Small Share of Stimulus Dollars for Energy Projects
Silicon Valley, California, US: HOUSEHOLDS SPEAKING FOREIGN LANGUAGES
Silicon Valley, U.S: SCIENCE & ENGINEERING WORKFORCE ORIGIN
Percentage of S&E Degrees Conferred to Temporary Nonpermanent Residents 2003 - 2007 Silicon Valley, California, US: STEM DEGREES CONFERRED TO FOREIGN STUDENTS Silicon Valley CA U.S. -1.8% -0.8% -1.1%
Growth in Emerging Markets Outpaces Advanced Economies
Silicon Valley, California: GRAD RATES, UC/CSU REQUIREMENTS
1995 - 2008 Jobs +53% Establishments +45% Silicon Valley: CLEANTECH FIRMS & JOBS
Silicon Valley: HOUSING AFFORDABILITY
Silicon Valley: PER CAPITA ELECTRICITY CONSUMPTION
2000 - 2008 Silicon Valley -13% Rest of California -2% Silicon Valley, California: FUEL CONSUMPTION PER CAPITA
Silicon Valley: DENSITY LEVELS, NEW CONSTRUCTION
Per Student Spending in Higher Education Is Decreasing