Download

1 / 71
720 likes | 909 Views
GausSPC ® = A QUICK GUIDE =. version 2. © RLS d.o.o., September 2005. CONTENTS. 1 Summary 2 User Interface 3 Data Exchange with Other Software 4 Working with GausSPC 4a Administrator level 4b Supervisor level 4c Operator level. 1 Summary.

E N D
GausSPC®= A QUICK GUIDE = version 2 © RLS d.o.o., September 2005
CONTENTS • 1 Summary • 2 User Interface • 3 Data Exchange with Other Software • 4 Working with GausSPC • 4a Administrator level • 4b Supervisor level • 4c Operator level
1 Summary GausSPC is a complete and statistically reliable, yet simple, SPC solution that stems from SPC practitioners’ needs.
GausSPC stems fromSPC practitioners’ needs • GausSPC emerged initially as a by-product of custom-designed metrology system projects. • It has grown from our clients’ needs to a stand-alone solution, rather than incorporate SPC functionality to an existing statistical package. • Logical, intuitive – and therefore simple – work-flows developed through working with people on the shop-floor. The expertise of people involved in conceiving GausSPC was primarily metrology and then statistics. • Usually, SPC is just one of the many activities performed by GausSPC users. Most companies do not have an SPC specialist.
Working with GausSPC isquick and easy • Administrator • Connects measuring devices (gauges) • Installs GausSPC (runs setup.exe) • Defines users (fills out one “form” for each user + two forms to set privileges and other properties of the supervisor and the operator level) • Supervisor • Defines characteristics to be measured (right clicks, fills out one form per characteristic) • Adds charts to the Report (right clicks, fills out one form per chart) • Sets measuring interface (fills out one form) • Operator • Conducts measuring
GausSPC is a complete andstatistically reliable SPC solution • GausSPC is a complete solution, which in a single package provides everything from automatic data acquisition from measuring devices to multi-lingual report generation. • Even the most demanding of our clients’ customers trust GausSPC. (example: our client Kom Marovt, and their customer BMW). • From the very beginning in 1990, there was not a single complaint about statistical correctness of GausSPC either from our clients or their customers. • In GausSPC, there are no “hidden” or “deeply burried somewhere” settings, which someone might once accidentally set and would later cause “misterious” mistakes.
GausSPC for global operations • SPC solution’s language flexibility is important to • users in your foreign subsidiaries (and other linked foreign businesses); • your foreign customers, who receive the SPC reports.
GausSPC incurrs lowTotal Cost of Ownership (TCO) TCO structure of typical SPC solutions: • Initial investment • License fee • Initial training fees • Training time (participants’ salaries) • Using SPC solution (simplicity!) • time • software administration – new workpiece set-up e.t.c. • operator’s time • probability/frequency/speed of making and detectingmistakes • Training new users • Upgrades Instead of a few days external training, only 30-60 mins* of internal training is required for a group of 3 to 9 operators* to work with GausSPC (* data from Training Reports – SGA Schefenacker Automotive Slovenia)
GausSPC for Process Improvement SPC for Workgroups! TQM and SPC are all about what people do, not about what technology does! If the SPC system is not convenient, if it is just one more thing for the operator to do, he or she will “sabotage” it. In most cases, SPC software is not used by statisticians. Software does not improve processes – people do!
Download the free trial version of GausSPC from www.gausspc.com GausSPC – no Ph.D. required!
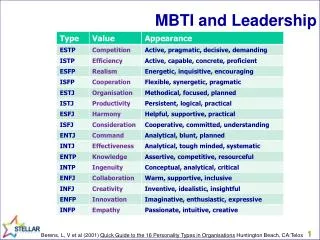
User Interface • There are three main windows (see the next slide): • 1. A spreadsheet window used to enter and view the data (Main Window) • 2. A window displaying user-defined graphic (or non-graphic) views of the process (Report Window) • 3. A quick chart, which can display a user-selected chart and basic statistical parameters for a characteristic after each entry of a new measurement for this characteristic. (Quick Chart) • All these windows can be opened simultaneously • All data and graphics in these windows are updated in real-time - whenever data is being entered, deleted or otherwise modified
User Interface Main Window Quick Chart Report Window
Spreadsheet data view column = dimension (e.g. first column is length) cell = a measured dimension (e.g. the first measured length was 25.02) Main Window Title Bar Menu Bar Tool Bar Cell Information Bar Dimension name Actual (measured) dimensions Cell Information Interface Information
Main Window - Tool Bar New file Show Report Window Add new chart/ table to the Report Window Open file Show Quick Chart Save file Interface channel selection Cut Open data file (operator level) Copy Channel is usually selected automatically, but it is also possible to set it manually. GausSPC also allows simultaneous readout of data from all the channels on a single trigger impulse. Paste Logoff current user
Quick Chart Title Bar Basic Statistical Parameters (depending on the type of statistical analysis selected) User-selected chart
Report Window Title Bar Menu Bar Report Header Report First-page-only Header Report Body is more than just a printed report preview! (see further slides) Report Body Source of data for current element (e.g. a run chart)
Information stored by GausSPC for each measurement (datapoint) • You can see detailed information about each datapoint in the Main Window... • ...or you can view basic information by sliding a mouse pointer over a graphical representation of a datapoint in the Report Window (see the next two slides) • Each data point includes information on who entered the data and when. • It also includes information on whether it was ever modified. • It is also possible to attach a note to each datapoint. • You can set GausSPC to beep whenever a new datapoint is entered, or when a new datapoint is out of tolerance.
Information about each measurement I A red triangle indicates the value in this cell has been modified Cell information Cell = C1 Value (Actual Dimension) = 26.95 Workpiece = Tube Dimension name = Inside diameter Nominal Dimension = 27.00 mm Position of Actual Dimension in respect to the Tolerance Area = in green A blue box indicates this cell has a note attached This cell is painted yellow because the dimension is out of the user-defined “reduced tolerance” This cell is painted red because the dimension is out of tolerance Note = (no note) Cell information (Operator who entered the data = Andrew S.; Time = 10 hr : 12 min : 04 sec; Date = June 7th, 2005)
Information about each measurement II Report Window is more than just a report preview! e.g.: by positioning a mouse pointer over a datapoint, some basic information about this datapoint can be seen. (it is easier and more convenient to identify “interesting” points on a chart than in a table)
Right click • Most common cell-related (datapoint-related) or column-related (dimension-related) functions can be reached by simply right-clicking on the cell / column • For Example: adding a new chart to the Report Window is as simple as right-clicking in the desired column (dimension) and selecting “Add New Chart”
Right Click – An Example click!
Right Click – Another Example click! Each chart has different properties which can be set. e.g. You can set the number of bars (divisions) of a Histogram. By default, the number of bars is a square root of n, where n is the number of datapoints.
Windows Clipboard • Windows Clipboard • You can copy/paste data to or from GausSPC through Windows’ Clipboard. Administrator can also disable this option for operators, but as previously explained, you can see for each cell copied into GausSPC when it was inserted and by whom. Windows is a registered trademark of Microsoft Corporation, Inc.
Text Files • Text Files • You can import data to GausSPC from text files of various formats
PC-DMIS ™ Files • PC-DMIS ™ text files: see the previous slide • PC-DMIS ™ *.rtf files • From the PC-DMIS™ software you can also import data from the text-only Rich Text Fromat (*.rtf) files. Measurements as well as characteristics can be imported. PC-DMIS is a registered trademark of Wilcox Associates, Inc.
4a Administrator level Setting up the system
Measuring device setup • Connect measuring devices to your computer See the measuring device manufacturer’s instructions for details! measuring devices interface-to-PC connection device-to-PC interface wireless device-to-interface connection interfaces operator your PC measuring device workpiece
one interface many gauges connected to the interface by cable Measuring devices – most common configuration
Measuring devices – an example configuration • 8 gauges on 8 channels wirelessly connected to the interface
Installing GausSPC • Run setup.exe • Setup Wizard will install GausSPC on your computer in a matter of seconds.
Starting GausSPC • Start GausSPC either by • clicking on the desktop icon, or • using Windows’ Start button • Start Programs GausSPC GausSPC
Setup of connections between your PC and gauges • When first started, GausSPC will ask you to set up the connections between your PC and any measuring devices • If you do not have any measuring devices connected to the PC, select “not connected”. • You can connect the measuring devices to your PC either • through a measuring interface, or • directly to computer ports • Some measuring interfaces emulate the keyboard. In this case no settings for the measuring interface are needed. Just select “not connected”. Settings for manual data entry will apply.
Connection between your PC and the measuring interface Select the computer port to which the interface is connected Select your interface If your interface is not listed, select an interface with the same number of channels. Choose “not connected” if you do not use an interface or if you use an interface emulating a keyboard You can also define a preset to be added to each measurement Select the types of measuring devices connected to the interface on different channels Select to which cell to move after the value from the device is entered into the current cell
Direct connection between your PC and gauges • Up to two gauges can connect directly to your PC’s COM ports Select the computer port to which the interface is connected Select the gauge You can also define a preset to be added to each measurement Select to which column the measurement from this gauge should go Select to which cell to move after the value from the device is entered into the current cell You can add a button for triggering the gauge from GausSPC
Logging in & defining user privileges and passwords • Whenrunning GausSPC for the first time, select the pre-defined user “Administrator GausSPC – 0001” and set your password 2. type in your password and click “OK” 1. select the pre-defined administrator user 3. Re-type the password and click “OK”
Logging in & defining user privileges and passwords • Once in GausSPC, you (as an administrator) can add or remove users, set their privileges and other properties. • In the menu, select: File User List
Logging in & defining user privileges and passwords • There are three levels of users in GausSPC: • administrator • supervisor • operator • Users set their passwords on their first log-in • For the supervisor and the operator levels, you can also set “no password required at log-in”
Congratulations! • You have successfully set up the system: • measuring devices are connected, • software is installed, • users are defined and user privileges are set. • In the future, you will • add new users, delete old users, and clear a user’s password if required • maybe set up new interfaces and measuring devices (could also be done by a supervisor)
4b Supervisor level Setting up the process information (preparing templates for operators)
Supervisor’s log-in • When you start GausSPC for the first time, you have to set your password: • Select your username from the pulldown menu: • Type in your password: • Retype the password to confirm:
Preparing a template for operators • Let’s say... • ...your operators will measure the length and the head diameter of an M3x25 screw
Setting dimensions • The first thing you should do is define the product dimensions (characteristics) to be measured. • As explained in the “2 User Interface” section, every column in the Main window represents one dimension. • To set a dimension, select the appropriate column or a cell in that column, and either • select Edit Product Characteristics... from the menu, or • right-click and select Product Characteristics... from the drop-down menu. (see the next slide)
Setting a dimension • Right-click in the appropriate column and select Product Characteristics...:
Setting a dimension • A Product Characteristic Dialog Box appears: Select “Simple” for dimensions for which you do not need statistical analysis (but you may want to keep a record of the measurements) You can set narrower “safety” tolerances not affecting statistical analysis (the “yellow area”) A characteristic may also be calculated instead of measured. e.g. for colulmn C: “(A-B)/2” Sample size for some charts (Xbar-R, Xbar-s, EWMA) Image (product image, instructions...) shown for this dimension when user presses F4 You can select the Quick Chart for this dimension
Setting dimensions • This is how the Main window looks when you have set both dimensions:
click! Setting the quick chart • By right-clicking the quick chart you can set the chart-specific parameters e.g., for the Xbar-R chart you might want to specify the criteria used to test the stability of the process: click! click!
Setting reports • To add a new element to the Report Window, either: • select the column (dimension) you want in the Report Window (selecting just one cell in that column will also do), then right click and select “New chart” from the pop-up menu, or • Select “New chart” from the Tool Bar. (see the next slide)