Download
1 / 29
290 likes | 358 Views
Understand how to measure molecular size and shape by determining Rotational Diffusion Rate through Fluorescence Spectroscopy.

E N D
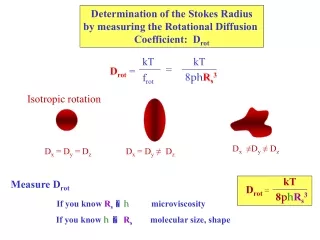
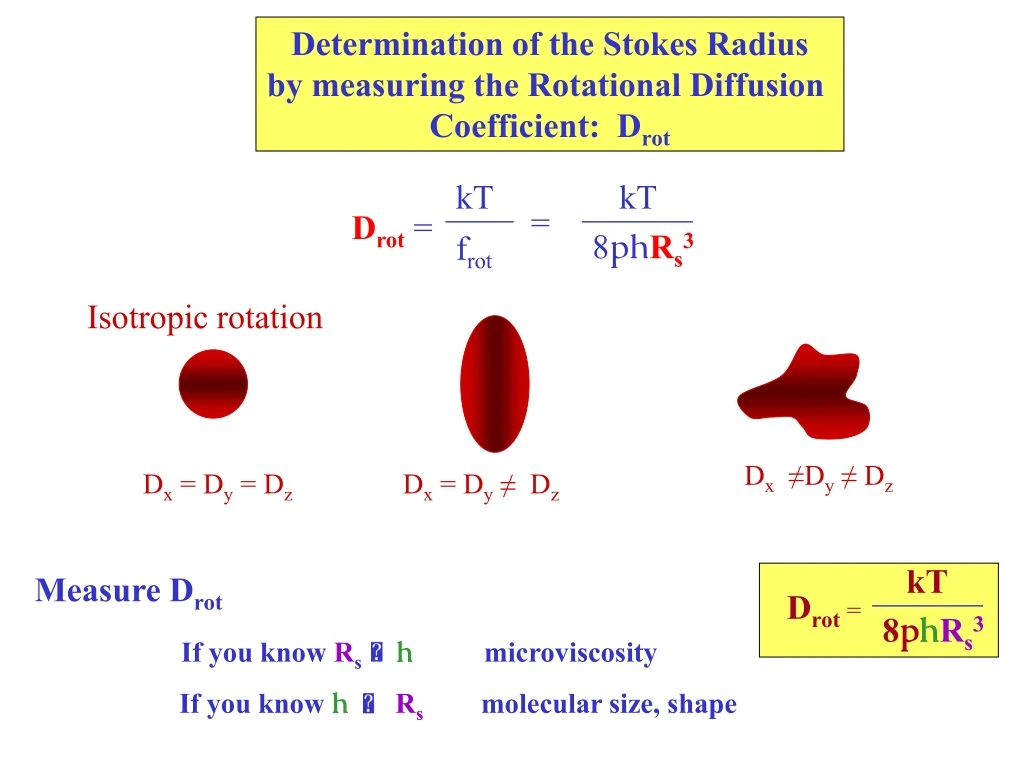
kT kT = Drot = 8phRs3 frot Determination of the Stokes Radius by measuring the Rotational Diffusion Coefficient: Drot Isotropic rotation Dx ≠Dy ≠ Dz Dx = Dy = Dz Dx = Dy ≠ Dz kT Measure Drot Drot = 8phRs3 If you know Rs h microviscosity If you knowh Rsmolecular size, shape
Rotational Diffusion Rate can be determined by Fluorescence Spectroscopy Fluorescence polarization (anisotropy) can measure how rapidly a molecule is tumbling in solution sample excitation light t1 t2 I I fluorescent light
preferential excitation of molecules whose is parallel to the electric field vector of the excitation light Fluorescence anisotropy For polarized excitation light, the probability of absorption of a photon depends on cos2 Z q hu X Y After excitation non-random distribution Before (random)
Fluorescence anisotropy After formation of the excited state, the molecule can rotate during the time prior to photon emission Z orientation upon absorption q rot hu orientation at the time of emission X Y
z-component = x-component = y-component = Iz proportional to < cos2q > Average over population Ix proportional to < sin2q > < cos2w > IY proportional to < sin2q > < sin2w > Fluorescence polarization Z The probability of detecting the emitted photon depends on the orientation of the transition dipole moment of the excited state molecule AT THE TIME OF EMISSION and the orientation of the polarizer in the detection device q X IZ w Y IX probability of detecting the photon with polarization along the z-axis = ||2cos2q x-axis = (sinq cosw)2 y-axis = (sinq sinw)2
III - I III - I Define: polarization, P = anisotropy, A = III+I III+2I -1 2 1 1 A = - 3 P 3 Fluorescence polarization Z q Define I = IZ X III = IZ w If we start with excitation light polarized along the z-axis, then Ix = Iy = I Y IX = I The total light intensity at the detector is Itot = III + 2I
III - I < cos2q > - < cos2w > < sin2q > A = = III+2I < cos2q > + 2 < cos2w > < sin2q > 3 < cos2q > - 1 A = 2 Polarization Relate Anisotropy to < cos2q > Z ^ q Since we excite with light polarized along Z, we must have symmetry about this axis - so w will always be random => < cos2 w > = 1/2 X w Y By measuring IX and IZ we can compute < cos2q > for the emitting molecules
Eex Z m E q What goes into < cos2q > ? Photoselection I Probability of absorption cos2q The excited state population is not randomly oriented immediately after excitation m of excited state molecules Excitation beam After excitation non-random (III > I ) Before (random)
II Change in m for absorption + emission abs 2 em IC m01 m02 m01 m02 1 Fixed angle l hu2 hu1 0 Change m photoselection What goes into < cos2q > ?
III What goes into < cos2q > ? Rotational diffusion: Rotational diffusion coefficient Drot Rotate Change m photoselection rotation
Z Z q Step 1 m View each of these as a series of isotropic displacementsof the average direction of the transition dipole moment Z Z l qrot Step 3 Step 2 Change m photoselection rotation Goal: Find average displacement () in terms of known parameters
3 < cos2q > - 1 3 < cos2aN > - 1 3 < cos2a1 > - 1 3 < cos2a2 > - 1 . ….. = 2 2 2 2 Z Z etc. a1 a2 Perrin’s equation: 3 < cos2q > - 1 3 < cos2q0 > - 1 3 < cos2l > - 1 3 < cos2qrot > - 1 . . = A = 2 2 2 2 1 Find this Measure this 2 3 Stokes radius |rot| Drot Use Soleillet’s equation - from geometry, describing a series of isotropic displacements of a vector
Z Z q Step 1 1 3 2 m Photoselection Photoselection: 3 < cos2q > - 1 3 < cos2q0 > - 1 3 < cos2l > - 1 3 < cos2qrot > - 1 . . = A = 2 2 2 2 Find this 1 Measure this Probability of absorption cos2q0 < cos2q0 > = 3/5 This is derived in the 346 Class Notes So A = 0.4 P = 0.5 Maximum values of Anisotropy and Polarization
2 m Emit from a different transition after internal conversion Change in : Large l Z Z 02 X X 01 Y Y 0.4 from photoselection 3 < cos2l > - 1 A0 = 0.4 2 A0 is the anisotropy obtained in the absence of molecular rotation - e.g., using frozen solutions or solutions with high viscosity Depends on excitation + emission wavelengths Maximum value for l = 90 so limits on A0 and P0 are -0.2 A0 0.4 -0.33 P0 0.5
3 < cos2qrot > - 1 A = A0 2 Rotational Diffusion: will always tend to bring A 0 or P 0 qrot Anisotropy of frozen sample < cos2qrot >= 1 if there is no rotation: A = Ao < cos2qrot >=1/3 for random orientation: A = 0
Rotational Diffusion: will always tend to bring A 0 or P 0 3 < cos2qrot > - 1 A = A0 3 < cos2q > - 1 3 < cos2dq > - 1 3 < cos2dq > - 1 3 < cos2dq > - 1 . ….. = 2 2 2 2 2 Z Z etc. dq dq 3 < cos2qrot > - 1 2 3 N = (1 - 6 Drotdt)t/dt Rotational Diffusion Ao value from photoselection plus change in Break down rotation into a series of N isotropic steps of size dq cos2dq = 1 - sin2dq 1 - dq2 For a small “step” Rotational Diffusion: < dq2 > = 4 Drotdt = 1 - 4 Drotdt
A = A0 e- 6 D t rot A 3 < cos2qrot > - 1 3 < cos2qrot > - 1 2 2 N = (1 - 6 Drotdt)t/dt = e- 6 D t rot Rotational Diffusion But (1-x) e-x for x << 1 Time-resolved Anisotropy yields Drot Calculate Drot Monitor anisotropy following a pulse of excitation light: time
f(t)dt t t Steady State Measurement of Fluorescence Anisotropy Fraction of photons emitted in (t, t+dt) = f(t)dt t+t t A(t) Average anisotropy A = A0 (1 + 6 Drott)-1 Perrin’s equation
substitute : V molecular volume 1 1 - P 3 Define: rotational diffusion time = Various forms of Perrin’s equation (1) (2) (3) Perrin plot (4) T h (5)
kT 8pRs3 Define: rotational diffusion time = Result for steady state fluorescence from a rotating molecule Fluorescence lifetime Measure this
H2N Protein Rotational Diffusion I. Extrinsic Probes + Dansyl chloride t = 14 nsec II. Results r0 = (3hV) / (kT) = (3hV2M) / (NkT) [(mol.wt) / 1.15] x 10-3 nsec find r (A0 / A) = 1 + (3t / r) Measure A0, A, t
Example: Fluorescence Anisotropy Measurement of Protein-Protein Interactions TATA-box Binding Protein (TBP) binds with high affinity to TBP-associated Factor subunit TAF130p 1. Label TBP with tetramethyl rhodamine at a reactive cysteine residue 2.To a solution of 100 nM TBP (labeled) titrate increasing amounts of TAF130p (0-255 nM) 3. Exitation at 540 nm; emission monitored at 575 nm Conclude: High affinity binding (Kd = 0.5 nM) Biological consequence: binding of TAF130p to TBP competes with DNA binding to TBP J. Biol. Chem., Vol. 276, Issue 52, 49100-49109, December 28, 2001
Fluorescence Anisotropy used to monitor Protein-DNA Interactions 1. 50 nM Rhodamine labeled DNA 2. Titrate TBP 3. Excitation at 580 nm/Emission at 630 nm SHOWS 1:1 COMPLEX 1. 1:1 DNA:TBP complex, with labeled DNA (50, 100, 250 nm TBP) 2. Titrate TAF130p SHOWS ELIMINATION OF TBP-DNA COMPLEX BY COMPETING TAF130p 1. 50 nm labeled DNA 2. Titrate with TAF130p SHOWS NO COMPLEX BETWEEN DNA AND TAF130p J. Biol. Chem., Vol. 276, Issue 52, 49100-49109, December 28, 2001
V molecular volume Fluorescence anisotropy used to measure microviscosity The rotational diffusion coefficient can be related to Molecular volume: V Measure this If you know V You can determine
Fluorescent Probes dissolved are used to measure Membrane microviscosity Diphenyl hexatriene (DPH) Perylene Hydrophobic probes: Probe dissolved in membrane bilayer • partition into membrane bilayer • do not bind to protein • rotation reports local viscosity Measure for specific probe Molecular constant: determine for probe in known viscosity (h) Then: A => h
Typically: for biological membranes h 1 Poise 100-times the viscosity of water Note: (1 / h)= fluidity of membrane
Example: The effect of deletion of the gene encoding -6-oleate desaturase in Arabidopsis thaliana Changes the fatty acid composition of the mitochondrial membrane: mostly oleic acid is present in the mutant (fad2) J. Biol. Chem., Vol. 276, Issue 8, 5788-5794, February 23, 2001
Membrane Fluidity monitored by the fluorescence Anisotropy of anthroyloxy fatty acid derivatives: the fluorophore is located at different depths in the membrane bilayer mutant wild-type mitochondrial membranes CONCLUDE: Decrease in unsaturation of the fatty acid components in the membrane results in increased anisoptropy, or increase in membrane viscosity Biological Consequence: decreased respiration and altered bioenergetics of the mitochondria Extracted lipids 2 18 depth in the membrane bilayer/position in fatty acid chain)