Download
1 / 24
250 likes | 364 Views
Investigating the maximum water flow rate for removing bottom water in oil-water pipe flow to maintain oil quality, using single-phase and two-fluid modeling approaches.

E N D
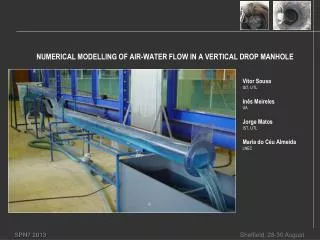
Numerical Study of Bottom Water Draw-Off of Stratified Oil-Water Pipe Flow Yousef Zurigat Bssam Jubran Lyes Khezzar Salam Al-Far Department of Mechanical and Industrial Engineering College of Engineering Sultan Qaboos University, Oman
Plan • Introduction & Objectives • Oil-water Transport & dehydration issues • Simulation Model • Results • Conclusions
Water issues in Oil-Production • Well life extension results in increased water Production (98%) • Need to separate water from oil (dehydration facilities cost money) • Pre-separation may take place in transport pipelines • Can we take advantage of it?
Concept of Bottom Water Draw Off • Depending upon prevailing conditions a water layer may form at the bottom of the pipe. • It can then be selectively removed.
Design Challenge of BWDO Concept • What is the maximum water flow rate that can be drawn off (With Acceptable quality)? • How can disturbance of the water/oil-in-water-dispersion interface be avoided? • If several draw-off points are used, how will the interface and flow regimes in between draw points be affected?
Objectives • For a single draw-off pipe, investigate the variation of oil concentration in the draw-off pipe as a function of draw-off flow rate and interface position.(Interface location not known a priori!!) • Investigate the maximum possible water flow rates with acceptable quality (oil concentration)for two consecutive draw-off pipes.
Flow Regimes of Oil-Water Mixtures • Depending upon the oil superficial velocity several regimes are possible for horizontal water dominated flows:
Geometry and Flow Parameters • Main pipe Diameter = 0.68 m • Draw-Off Pipe Diameter = 0.240 m • Oil-flow rate = 8049 m3/day • Water flow rate = 43614 m3/day • Interface Location 25 cm from bottom of main pipe. • Simulation conducted with one and two draw-off pipes
Modelling challenges • Flow is complex and two-phase (dispersions present) • Two Approaches: 1. Single-Phase Flow Modeling: If negligible slip between the phases and hold-up take place--In the present regime!! (water- cut=85%, water superficial velocity=1.3 m/s)! 2. Two-Fluid Flow Modeling: Actual Flow
Mathematical Model SINGLE-PHASE FLOW MODEL • Steady, Single-phase, incompressible and turbulent flow. • Pressure drop approaches that of single phase flow • Flow dynamics very similar to single phase flow • Full three-D simulation
Quantitative analysis of draw-off water quality-Single : Phase Flow Model • Initial oil concentrations in the pipe regions above and below the interface are based on experimental data. The concentration of oil in free water assumed equal to 600 ppm in accordance with field data. • The amounts of oil in the areas above- and below-the-interface streams which make up the draw-off flow are calculated based on the flow rates and the concentrations calculated in the first step above.
Cut-off flow rates with water quality <2000 ppm from two tappings
Two-Fluid Modeling • In the PHOENICS, the concept of thermo- dynamic phase is used, i.e., the water and oil are treated as two different phases in the mixture. These two phases are in motion relative to each other due to the buoyancy effect, which leads to inter-phase momentum transfer. • The Inter-Phase Slip Algorithm (IPSA) is adopted to predict the phenomenon in this work.
Phase equations • Each phase is regarded as having its own distinct velocity components. • Phase velocities are linked by interphase momentum transfer - droplet drag, film surface friction etc. • Each phase may have its own temperature, enthalpy, and mass fraction of chemical species. • Phase concentrations are linked by interphase mass transfer.
Phase equations (Cont.) t time Ri volume fraction of phase i ri density of phase i fi any conserved property of phase i velocity vector of phase i Gf,i exchange coefficient of the entity f in phase i Sf,i source rate of fi
Pipe 1 Pipe 2 Results (Cont.)
AcknowledgementsPDO’s FUNDING OF THIS WORK IS GRATEFULLY ACKNOWLEDGED