Download
1 / 25
250 likes | 395 Views
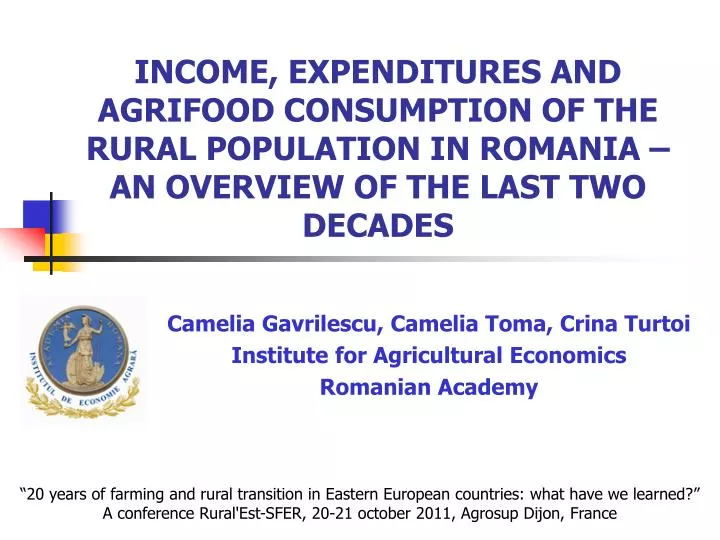
INCOME, EXPENDITURES AND AGRIFOOD CONSUMPTION OF THE RURAL POPULATION IN ROMANIA – AN OVERVIEW OF THE LAST TWO DECADES. Camelia Gavrilescu , Camelia Toma , Crina Turtoi Institute for Agricultural Economics Romanian Academy.

E N D
INCOME, EXPENDITURES AND AGRIFOOD CONSUMPTION OF THE RURAL POPULATION IN ROMANIA – AN OVERVIEW OF THE LAST TWO DECADES CameliaGavrilescu, CameliaToma, CrinaTurtoi Institute for Agricultural Economics Romanian Academy “20 years of farming and rural transition in Eastern European countries: what have we learned?” A conference Rural'Est-SFER, 20-21 october 2011, Agrosup Dijon, France
During the last 2 decades ... • Romania has made huge efforts to achieve several goals in its agrifood sector: • to transform it from a centrally planned to a market-driven one; • to develop and modernise it; • to adapt it to the requirements imposed by the accession to the European Union
Rural area in Romania means … • 45% of the total population (45.7% in 1990 44.9% in 2009)
Agricultural and industrial employment (% in total employment)
Factors influencing that trend… • Intrinsic to the agrifood sector: • restructuring of land ownership and use; • restructuring of the agrifoodchains; • Good / bad agricultural year • Extrinsic to the agrifood sector: • restructuring in secondary and tertiary economic sectors • increasing urban unemployment • lack non-agricultural unemployment • Inflation • exchange rate etc.
Average and minimum salary in the Romanian economy (1990=100)
Income in the agricultural sector • Dynamics of household income is a reflection of: • economic conditions • constraints that have been increasingly tougher • Various types of reactions in the agrifood sector: • Occupational diversification: • Pluriactive households • Decrease of full-time agricultural employment • Migration of labor (to urban areas / abroad) • Investment and development
Income structure in agricultural households (average 2002-2009)
Income structure in agricultural households • High share of on-farm consumption (~50%) • Low share of agrifood product sales (14-20%) • Daily income per capita in rural households: 3-4 EUR • Income in farmer householdsare only 50-56% of those in urban households
Main trends in food consumption (crop products) • high consumption of bread and cereal products, that represent the basic food items for all household types. • cereals provide 45% of calories in population’s diet (48% in the rural area) low food diversification; • increase of consumption in cereals, potatoes and vegetables until 2001-2002; • cereals • potatoes • fruit and vegetables • decline of fruit consumption due to domestic production decline and price increase
Main trends in food consumption (animal products) • low consumption of meat and meat products, compared to the European average • pork and chicken = 75-80% of total fresh meat consumption • low preference for beef (<10-13%; 8-10% in rural areas) • very low preference for fish • high share of consumption from household own resources for certain products such as eggs and milk
Main trends in food consumption (animal products) • last 8 years (since 2002): • fresh meat - increase of total quantity (~20%) • increase of chicken at expense of beef but mostly of pork • in rural areas, chicken is already half of total fresh meat consumption • increase of milk and dairy products consumption, mainly due to domestic production increase
Main trends in food consumption • high consumption of bread and cereal products, that represent the basic food items for all household types • cereals provide 45% of calories in population’s diet (48% in the rural area), which implies a low food diversification • Almost ¾ (72-76%) of the daily ratio is coming from non-animal calories
General conclusions • Romania has made huge efforts to develop its agrifood sector and rural areas • Still high agricultural employment • Moderate efficiency (GDP per person employed in agriculture) • Lower labor prices as compared to other MS • High level of on-farm consumption • Food model shows low income and inadequate nutritional ratios mostly in rural areas