Download

1 / 8
90 likes | 266 Views
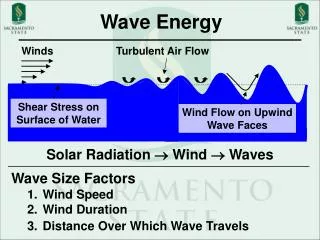
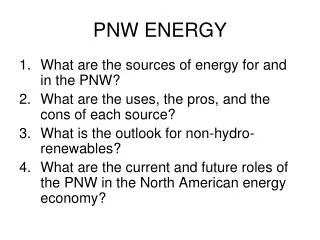
PNW Wave Energy. Note: much of this slide show is composed of slides utilized from the Wallace Energy Systems and Renewables website (Oregon State University ). Waves. Waves are a concentrated form of solar energy Technology to convert wave energy to electrical energy is in its beginning phase

E N D
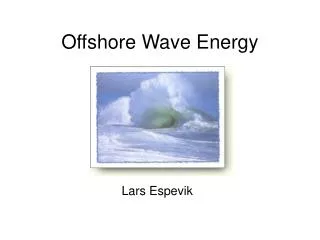
PNW Wave Energy • Note: much of this slide show is composed of slides utilized from the Wallace Energy Systems and Renewables website (Oregon State University)
Waves Waves are a concentrated form of solar energy Technology to convert wave energy to electrical energy is in its beginning phase > 1000 Patents < 2 MW Installed Demonstration in the U.S. is the Next Needed Step in the Technology Development Process
Wave Energy (con’t.) • high energy density (~30 kWh/m/day vs. solar~4-7 kWh/m2, wind 0.6-1.0) • higher energy availability (80-90% of the time) • higher predictability • seasonal cycle is good fit with current PNW supply and demand (has winter max., while natural hydroelectric is winter minimum) • most of US pop. lives <50 miles from coasts
Potential Wave Energy Impact on Oregon (Load Data Provided by PGE) Oregon 2005 Avg Consumption Generation West of Cascades: 3,488MW (68%) 2,487MW (29%) (1001MW deficit) East of Cascades: 1,633MW (32%) 6,163MW (71%) Total: 5,121MW 8,650MW From the previous slide (Winter avg is 50kW/m, Summer avg is 10kW/m), Considering an overall average of 30kW/m and an Oregon coastline of 460km, the total Oregon coast “raw” Wave Energy potential is in the range of 13,800MW In Perspective Seven sites have been identified by EPRI study, with the potential to expand to 100MW (estimated that three sites could be fully licensed in next 7-10 years) Oregon goal for 25% renewables by 2025 (this goal could be 50% satisfied by 700MW from wave energy, based on current consumption)
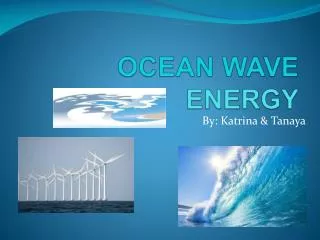
Power From Ocean Waves • Wave energy is strongest on the west coasts and increases toward the poles. • At approx. 30 kW/mcl in the Northwest (yearly avg.), a single meter (3.3 feet) of wave has the raw energy to power about 23 homes. [George Hagerman]
Power from Ocean WavesAvailable Resource off Oregon Coast Data buoys are 2-200mi off shore, with waves traveling 15-20mph, gives 10+ hours forecast time for buoy generators located 2 mi out Seasonal variation – Good match for the NW load demand (wave data From National Data Buoy Center, Power estimated from 5 buoys off the Oregon coast over past 10 years) Power from a wave is W/m of crest length (distance along an individual crest) = the density of sea water = 1025 kg/m3 g = acceleration due to gravity = 9.8 m/s2 T = period of wave (s) (averages 8s in the winter to 6s in the summer) H = wave height (m) (averages 3.5m in the winter to 1.5m in the summer)
EPRI Study: Seven Oregon Sites • Astoria • Garibaldi INSERT OREGON MAP ‘Wave Park’ Sites Identified by EPRI Study • Newport • Cushman • Reedsport • Coos Bay • Brookings