Homogeneous Semiconductors
540 likes | 847 Views
Homogeneous Semiconductors. Dopants Use Density of States and Distribution Function to: Find the Number of Holes and Electrons. Energy Levels in Hydrogen Atom. Energy Levels for Electrons in a Doped Semiconductor. Assumptions for Calculation.

Homogeneous Semiconductors
E N D
Presentation Transcript
Homogeneous Semiconductors • Dopants • Use Density of States and Distribution Function to: • Find the Number of Holes and Electrons.
Density of States (Appendix D)Energy Distribution Functions(Section 2.9)Carrier Concentrations(Sections 2.10-12)
GOAL: • The density of electrons (no) can be found precisely if we know 1. the number of allowed energy states in a small energy range, dE: S(E)dE “the density of states” 2. the probability that a given energy state will be occupied by an electron: f(E) “the distribution function” no = bandS(E)f(E)dE
For quasi-free electrons in the conduction band:1. We must use the effective mass (averaged over all directions)2. the potential energy Ep is the edge of the conduction band (EC) For holes in the valence band:1. We still use the effective mass (averaged over all directions)2. the potential energy Ep is the edge of the valence band (EV)
E(x) conduction band EC EV valence band x Energy Band Diagram Eelectron S(E) Ehole note: increasing electron energy is ‘up’, but increasing hole energy is ‘down’.
Reminder of our GOAL: • The density of electrons (no) can be found precisely if we know • 1. the number of allowed energy states in a small energy range, dE: S(E)dE • “the density of states” • 2. the probability that a given energy state will be occupied by an electron: f(E) • “the distribution function” • no = bandS(E)f(E)dE
Fermi-Dirac Distribution The probability that an electron occupies an energy level, E, is f(E) = 1/{1+exp[(E-EF)/kT]} • where T is the temperature (Kelvin) • k is the Boltzmann constant (k=8.62x10⁻⁵ eV/K) • EF is the Fermi Energy (in eV) • (Can derive this – statistical mechanics.)
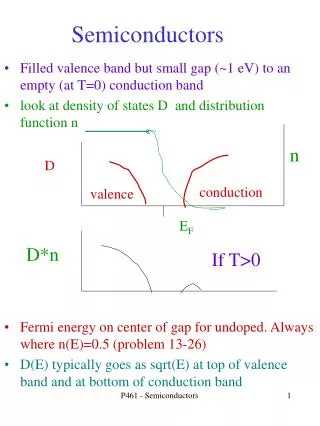
1 T=0 oK T1>0 f(E) T2>T1 0.5 0 E EF f(E) = 1/{1+exp[(E-EF)/kT]} All energy levels are filled with e-’s below the Fermi Energy at 0 oK
Fermi-Dirac Distribution for holes Remember, a hole is an energy state that is NOT occupied by an electron. Therefore, the probability that a state is occupied by a hole is the probability that a state is NOT occupied by an electron: fp(E) = 1 – f(E) = 1 - 1/{1+exp[(E-EF)/kT]} ={1+exp[(E-EF)/kT]}/{1+exp[(E-EF)/kT]}- 1/{1+exp[(E-EF)/kT]} = {exp[(E-EF)/kT]}/{1+exp[(E-EF)/kT]} =1/{1+ exp[(EF - E)/kT]}
The Boltzmann ApproximationIf (E-EF)>kTsuch that exp[(E-EF)/kT] >> 1 then, f(E) = {1+exp[(E-EF)/kT]}-1 {exp[(E-EF)/kT]}-1 exp[-(E-EF)/kT] …the Boltzmann approx. similarly, fp(E) is small when exp[(EF - E)/kT]>>1: fp(E) = {1+exp[(EF - E)/kT]}-1 {exp[(EF - E)/kT]}-1 exp[-(EF - E)/kT] If the Boltz. approx. is valid, we say the semiconductor is non-degenerate.
f(E) 1 T=0 oK T1>0 T2>T1 S(E) 0.5 0 E EV EF EC n(E)=S(E)f(E) E Putting the pieces together:for electrons, n(E)
S(E) Putting the pieces together: for holes, p(E) fp(E) T=0 oK 1 T1>0 T2>T1 0.5 0 E EV EF EC p(E)=S(E)f(E) hole energy
Finding no and po the effective density of states at EC the effective density of states at EV
Energy Band Diagramintrinisic semiconductor: no=po=ni nopo=ni2 E(x) conduction band EC n(E) EF=Ei p(E) EV valence band x where Ei is the intrinsic Fermi level
Energy Band Diagramn-type semiconductor: no>po E(x) nopo=ni2 conduction band EC EF n(E) p(E) EV valence band x
Energy Band Diagramp-type semiconductor: po>no E(x) nopo=ni2 conduction band EC n(E) EF p(E) EV valence band x
A very useful relationship …which is independent of the Fermi Energy Recall that ni = no= pofor an intrinsic semiconductor, so nopo = ni2 for all non-degenerate semiconductors. (that is as long as EF is not within a few kT of the band edge)
The intrinsic carrier density is sensitive to the energy bandgap, temperature, and (somewhat less) to m*
The intrinsic Fermi Energy (Ei) For an intrinsic semiconductor, no=po and EF=Ei which gives Ei = (EC + EV)/2 + (kT/2)ln(NV/NC) so the intrinsic Fermi level is approximately in the middle of the bandgap.
Higher TemperaturesConsider a semiconductor doped with NA ionized acceptors (-q) and ND ionized donors (+q), do not assume that ni is small – high temperature expression. positive charges = negative charges po + ND= no + NA using ni2 = nopo ni2/no + ND= no+ NA ni2 + no(ND-NA) - no2 = 0 no = 0.5(ND-NA) 0.5[(ND-NA)2 + 4ni2]1/2 we use the ‘+’ solution since no should be increased by ni no = ND - NA in the limit that ni<<ND-NA
Temperature variation of some important “constants.” Simpler Expression
impurity band EC ED1 + + + + Eg0 Eg(ND) EV for ND > 1018 cm-3 in Si Degenerate Semiconductors 1. The doping concentration is so high that EF moves within a few kT of the band edge (EC or EV). Boltzman approximation not valid. 2. High donor concentrations cause the allowed donor wavefunctions to overlap, creating a band at Edn. First only the high states overlap, but eventually even the lowest state overlaps. This effectively decreases the bandgap by DEg = Eg0– Eg(ND).
EC (intrinsic) DEg EF available impurity band states filled impurity band states EC (degenerate) ~ ED apparent band gap narrowing: DEg* (is optically measured) Eg* is the apparent band gap: an electron must gain energy Eg* = EF-EV EV - Degenerate Semiconductors As the doping conc. increases more, EF rises above EC
Electron Concentrationin degenerately doped n-type semiconductors The donors are fully ionized: no = ND The holes still follow the Boltz. approx. since EF-EV>>>kT po = NV exp[-(EF-EV)/kT] = NV exp[-(Eg*)/kT] = NV exp[-(Ego- DEg*)/kT] = NV exp[-Ego/kT]exp[DEg*)/kT] nopo = NDNVexp[-Ego/kT] exp[DEg*)/kT] = (ND/NC) NCNVexp[-Ego/kT] exp[DEg*)/kT] = (ND/NC)ni2 exp[DEg*)/kT]
Summary non-degenerate: nopo= ni2 degenerate n-type: nopo= ni2 (ND/NC) exp[DEg*)/kT] degenerate p-type: nopo= ni2 (NA/NV) exp[DEg*)/kT]