Download
1 / 33
350 likes | 574 Views
Development of lithium beam probe and measurement of edge density profile on JT-60U Atsushi Kojima, 小島有志 JAEA 2009/2/18 at ASIPP. Introduction. Edge Region in H mode Plasma. ELMy H mode is a standard operational scenario for ITER.

E N D
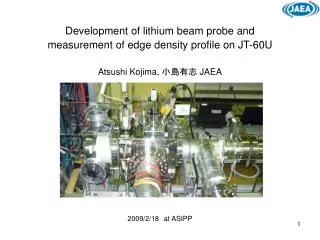
Development of lithium beam probe and measurement of edge density profile on JT-60U Atsushi Kojima, 小島有志 JAEA 2009/2/18at ASIPP
Introduction Edge Region in H mode Plasma ELMy H mode is a standard operational scenario for ITER. • Short lifetime of divertor target due to type I ELM is a critical problem. =>ELM control techniques (RMP, pellet pacing) and small ELM operations (grassy ELM) are developed. Before ELM ELM Crash Heat Load to Divertor Pedestal height ~kPa Pressure After ELM Pedestal width~cm Bootstrap Current by P Current r/a 0.7 0.8 0.9 1.0 Understandings of Edge plasma physics improves ELM controls and pedestal performance. • Edge density profile during ELM cycle was not obtained in JT-60U. • To investigate behaviors of edge density and edge current profiles with high time and spatial resolutions, • Lithium Beam Probe is developed. NEW
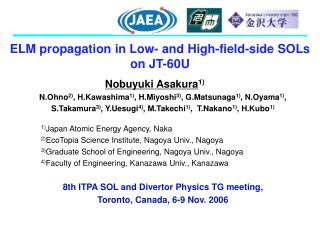
Background and Objective • Background: • Type I ELM behaviors have been investigated with tangential NBIs (co and counter directions) in JT-60U. • Toroidal rotation vary ELM size and frequency. • →Why and How do ELMs change? Ctr Co Ref: K. Kamiya PFR. 2, 005 (2007). • Objective: • Development of LiBP with high resolutions (1ms, 1cm) for ELM dynamics • Experimental observation of edge density profile during ELM cycle • →Understanding of physics for ELM control • ELM affected area ~ ELM size DWELM
Outline Outline: • Development of LiBP on JT-60U • Development of large-current and low-divergence Li beam • Edge density profile measurement using LiBP • Type I ELM Dynamics • ELM affected area in Co- and Ctr rotating plasmas • Summary
Lithium beam probe development on JT-60U. • Edge diagnostics using LiBP • edge ne from beam emission profile • edge j from Zeeman polarimetry • resolutions of 1ms and 1cm are desired. • Development of Li ion gun • Low beam energy ~ 10keV • optimum penetration in neped=1~3x10¹⁹m-3 • small Doppler broadening is a merit for Zeeman spectroscopy (0.08nm splitting@4T) • large beam current ~ 10mA extraction • more than 1mA at 6.5m (effective beam intensity) • low divergence angle ~ 0.4 degree • long beam line, Zeeman spectroscopy • Challenging diagnostic Li0 beam • ⇒design study by beam simulation Long Beam Line
Test stand of Lithium Beam System Li Ion Source Na Vapor Neutralizer Ion Gun HVT 70cm XY beam monitor (2.3m) diagnostic region (6.5m) b eucryptite (Li2O・2SiO2・Al2O3)soaking to porous tungsten disk(50mm) Beam Line 6.5m Neutralizer Li0 Li+ Electron Beam Heating ~1500degC 300degC
Li ion gun using EB heated ion source is developed. 10kV -20kV (Strong Extraction) Li0 Li+ heater ~300℃ Na EB Heating~1500℃ Porous W b eucryptite Mo 50mm 7Li, porosity 30%, Temp~1500℃ Life time~3.5 A・sec (1g) • Li ion gun is newly developed. • 50mm EBH Ion source has capability to extract 10mA Li ion beam. • Extractor enables low energy (10keV) large current extraction (10mA). • 10mA, 50sec operation is demonstrated. A. Kojima, et al 2008 Rev. Sci. Instrum. 79 093502.
3mA, 0.2deg, FWHM=0.05nm Li0 beam is obtained at 6.5m. Effective Beam Intensity ~3mA FWHM of Beam Emission ~0.05nm • 3mA, 0.2deg Li0 beam is obtained at plasma edge (6.5m from neutralizer) • small divergence angle corresponds to good spectrum resolutions. • FWHM of spectrum ~0.05nm • < Zeeman splitting ~0.08nm@4T • Etalon (DlFWHM=0.08nm) and interference (DlFWHM=1nm) filters are utilized.
Density profile (L to H mode) is successfully reconstructed. Ip=1.6MA, Bt=3.95T, d=0.34, q95=4.3 Li0 Li0 L ELM free H H Li signal Beam Chop • Edge density measurement (DR~1cm, Dt~0.5ms) is demonstrated. • Density profile during ELM cycle can be investigated. Not Reconstructed
Density loss fraction (type I ELM) is 30% at pedestal region. recovery 0.5sec ELM averaging Type I ELM (fELM=37Hz) Ip=1.6MA, q95=4.3, d=0.34, PNB=11.7MW, bp=0.85, li=0.83, ne*= 0.29 Before ELM neped After ELM pivot ~30% Density pedestal recovers in 10ms after ELM crash. • Density pedestal shoulder is 4cm from separatrix. • At pedestal region, density loss fraction due to type I ELM is 30%.
Density loss fraction of Ctr-rotation is smaller than Co-. Ip=1.6MA, q95=4.3, d=0.34, fELM=45Hz, PNB=12.9MW, bp=0.81, li=0.83, ne*=0.33 neped Co Ctr pivot Co:30% Ctr:20% • Density pedestal width is similar. 4cm~4.5cm from separatrix neped : Co > Ctr • Ctr-rotating plasmas have smaller density loss fraction, 30% (Co) > 20% (Ctr) smaller affected area. YAG Thomson
Ctr-Rotating plasmas have weaker gradient. Co-rotation Ctr-rotation FWHM=2.6cm FWHM=2.3cm • Piped (CO) > Piped (CTR) • DPiped/Dr (CO) > DPiped/Dr (CTR) Wider gradient profile cause radial expansion of eigen function of unstable mode. ⇔ Small and narrow crash of ctr-rotating plasma may be caused by weaker gradient profile.
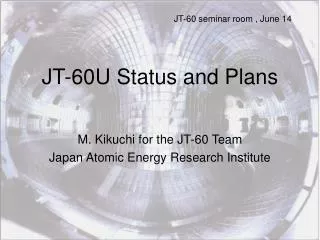
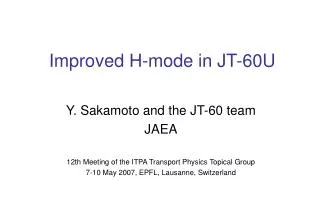
4. SUMMARY • Development of lithium beam probe system • 10mA-class lithium beam is developed. • Edge density measurement is successfully demonstrated. • Edge density measurement • Edge density profile during type I ELM is observed for the first time. • Small normalized ELM energy loss of ctr-rotating plasma is caused by different pressure profile. • Now, we try to carry out the stability analysis to explain the different ELM size by toroidal rotations.
Behavior of edge plasma is obtained during ELM cycle. Edge Diagnostics on JT-60U E49228 t6.8s LiBP (R~1cm, t=0.5ms) CXRS (R~0.6cm, t=2.5ms) Thomson ECE (R~1.2cm, t=20ms) ELM onset fELM=37Hz recovery Edge ne, Te, Ti during ELM are measured simultaneously with high time and spatial resolutions.
ne and Ti loss fractions have different Ip dependence. 1.6MA Co neped Tiped 1.6MA Co 1MA Co 1MA Co Ip=1.0MA, q95=4.1, d=0.39, fELM=75Hz , PNB=10.9MW, bp=1.3, li=0.83, ne*= 0. 45 • Density pedestal width is ~1cm wider than high Ip case. (bp=0.85->1.3) n/Dn and T/DThave different Ip dependence. Increases of ne and DT (conductive component) is dominant in high Ip case. (DWELMconv~TDn, DWELMcond~nDT)
Density Loss due to Grassy ELM is smaller than Type I ELM. 100msec 50msec large grassy and small type I ELMs (E48999) fELM=200Hz (Ip=1.0MA, q95=4.3, d=0.54, PNB=9.4MW) fELM=500Hz • Difference of grassy and type I ELMs is small Increase of nesep. =>Enhanced recycling from divertor is small. • Grassy ELM (1MA, fELM~200Hz, grassy ELM in mixture ELMs) affects 20% of density, and radial extent is 5cm. (Type I -Dne/ne~30%, 10cm~) • Grassy ELM with higher frequency has smaller crash (<5%~noise level).
3-2. Evolution of pressure gradient are different. 37Hz 45Hz 75Hz Evolutions of ion pressure gradient in each case show • Pressure gradient of 1.6MA ctr-rotations (fELM~45Hz) and 1MA co-rotation (fELM~75Hz) cases is not saturated. • Pressure gradient may have limit and trigger ELM. • 1.6MA co-rotations (fELM~37Hz) case is unclear. • pressure gradient and edge current may play a role for the ELM trigger. • Stronger pressure gradient of co-rotation case suggest rotation effect on stability limit.
2-1-2. Reduction of Ion Temperature in Ctr-Rotation is also smaller than Co-Rotation. Tiped Co Ctr Type I ELM (fELM=37Hz) pedestal Ti increases monotonically. • Ti pedestal shoulder is located at 4cm~5cm, and the difference is unclear. • ELM loss fraction of ne and Ti is small in ctr-rotation. • Observed small normalized ELM energy loss is caused by small loss fraction profile. <DWELM/Wped> (Co,Ctr)=(8.2%, 6.1%)
1. Pedestal ne and Ti are observed by newly developed diagnostics (Lithium Beam Probe, Charge eXchange Recombination Spectroscopy).
Line density and pedestal density behave different. Density crash and recovery in ELM cycle are observed by profile measurement. FIR interferometer (U2 port) FIR interferometer (U1 port) ELM collapse decrease of neped decrease of ∫nedl2 t :crash ~200ms Flux to divertor E49228 time delay time delay neped [1019m-3] increase of nesep increase of ∫nedl1 Enhanced recycling ∫nedl2 [1019m-2] U2 port increase of neped decrease of nesep Relaxation and Pedestal recovery ∫nel1 [1019m-2] U1 port t :recover ~10ms Time delay between neped and ∫nedl2 has information of pedestal recovery. nesep [1019m-3]
Core density recovers the lost density nelIN+OUT nelIN DnelIN+OUT nelOUT DNeL pivot nelIN= -0.15m~pivot point (recovery from crash) nelOUT = pivot point~+0.1m (decay of enhanced recycling) nelIN ~ nelOUT DNeL2 = DnelIN + DnelOUT+DNeL =DnelIN+OUT+DNeL 0 core region Dnelcore indicates core density behavior! drop of corresponds to 2% density reduction of core region. It may recovers the lost pedestal density.
10mAを引き出し、良い温度分布を持つLiイオン源の開発に成功した。10mAを引き出し、良い温度分布を持つLiイオン源の開発に成功した。 タングステンディスク 2007年式 電子ビーム加熱 2006年式 ヒーター加熱(市販品) 2007年式 >1400℃ >10mA 5000倍 2006年式 <900℃ <2μA モリブデンマウント 接触面の熱伝導が悪く、温度が上がらない 電子ビームで直接加熱(最大5kW) フィラメント 【課題】 ビーム開発はイオン源が命!! 大電流(タングステン表面積・表面温度) 、収束性(タングステン表面温度分布・表面形状) 、長寿命(タングステン空孔率)、制御性(電子ビームパワー)、メンテナンス性(イオン源構造)、耐熱性(構造材) 、加熱効率(加熱パワー、放射冷却対策)の要求全てを満たすイオン源 【工夫】 • 1400度を超える電子ビーム加熱イオン源を独自に設計・製作 • フィラメント形状で温度分布を制御し、収束性の良い中心ピーク分布を実現 • イオン放出面を凹状にして収束性の向上 【結果】 2007年式電子ビーム加熱イオン源で設計値通りの高性能を得た。
新型イオン銃で10mA大電流Liビームの50秒間引出を達成した。新型イオン銃で10mA大電流Liビームの50秒間引出を達成した。 プレ加熱(40秒) 10mA、50秒間の長時間引き出し 10mA, 50sec 【特徴・工夫】 • 収束性 中心ピークの温度分布、凹状放出面、 電極形状の最適化 • 低エネルギー・大電流 引出電極で強引出電場 Ref. Plasma Fusion Res. 2, S1104 (2007) 【課題】 Naが電極・セラミックスに付着し、急激な絶縁劣化が問題化 【工夫】 • Naフラックスが絶縁用セラミックスを見込まないように対策 • 中性化効率95%での最適な運転 【結果】 10keV、10mAの大電流Liビームを50秒間安定に引き出すことに成功。(電子ビームによる温度分布の緩和時間~10秒程度) • 引出電極が低エネルギー大電流ビーム引出の鍵。 (ビーム電流を制御できる。計測に便利) 運転温度 280度95%
到達ビーム電流3mA、0.2度の高輝度・低発散Liビームを実現した。到達ビーム電流3mA、0.2度の高輝度・低発散Liビームを実現した。 ビームの発光スペクトル 中性化セル0m ビームモニター2.3m6.5m Li+ Li0 到達ビーム電流 3mA ビーム径 5cm 発散角 0.2度 【課題】6.5m先でのビーム径を抑え、発散角がゼーマン偏光計測(0.08nm)に有効なビーム生成・維持。6.5m先で60mmの計測器に合わせるコントロール。 【工夫】ビームモニター(十字型のワイヤープローブ)によるビーム位置確認 【結果】 発散角0.2度(目標値0.4度)、ビーム径5cm、到達ビーム電流3mA(目標値1mA) Heガス入射でゼーマン分離よりも小さいスペクトル幅を得て、JT-60に移設した。 ⇒世界最大のリチウムビームプローブ To be published to Rev. Sci. Instrum.
漏れ磁場を低減し、ビーム制御手法を確立し、プラズマ計測に成功した。漏れ磁場を低減し、ビーム制御手法を確立し、プラズマ計測に成功した。 22mm ビーム幅方向の3ch プロファイルモニター リチウムイオン銃 中性リチウムビーム ビームライン JT-60 【課題】 JT-60のポロイダルコイルによる漏れ磁場(300ガウス)を1/1000低減する。 6.5m先の22mm幅にビーム中心を合わせるビームコントロール。 【工夫】 • 三層式の磁気シールド(設計では0.2ガウスに低減)を設計・製作 • プラズマ表面にビーム幅方向の分布・位置計測チャンネルを設置 【結果】ポロイダルコイル通電時も漏れ磁場の影響なく、XYビームモニターでビームラインの通過を確認し、プロファイルモニターでさらに詳細に位置を決め、プラズマ計測に成功した。 XYビームモニター
世界で初めて周辺局在モードによる密度分布の崩壊を詳細に捉えた。世界で初めて周辺局在モードによる密度分布の崩壊を詳細に捉えた。 1.1MA / 2.5T, d=0.18 ELMによる 周辺密度崩壊 SOL ペデスタル 【結果】 世界で初めて周辺局在モード(ELM)による周辺密度分布の崩壊を高時間・空間分解能でSOLからペデスタル領域にわたり詳細に捉えた。 時間分解能<0.5msec、空間分解能<1cm 【意義】 周辺プラズマの構造形成の理解に繋がり、ELMによる粒子・熱流束の定量評価からITERにおけるダイバータ設計に大きく貢献できる。
10 イオン銃をJT-60に移設し、JT-60プラズマ入射に成功した。 真空排気設備 磁気シールド イオン銃 • JT-60の漏れ磁場(300G)を0.1G程度に抑える磁気シールドを設計した。 • Liイオン銃、高電位テーブルをJT-60に移設し、初期調整後プラズマ入射に成功した。 • 10mA引出に向けて現在コンディショニング中。 ビームライン
11 設計した入射光学系をJT-60に設置し、計測システムを整えた。 • 計測点 ペデスタル計測に特化し、スポット6mm ペデスタル10ch、Δch=9.5mm コア/SOL10ch、Δch=16mm ビーム幅を含めた分解能は1cm程度 • データ収集系 20ch、1MHzサンプリングの高速データ収集系を利用し、密度揺動計測にも備えている。
PEMによる偏光測定 • 2つのPEM(光弾性変調器)とポラライザーとを組み合わせて、特定波長の偏光成分を光強度の周波数成分へ変換する。 • 下図の配置の場合、透過光I3の周波数成分は以下で与えられる(f1 = 20 kHz, f2 = 23 kHz)。J1(•), J2(•)は1次、2次のベッセル関数。f1, 2f1, 2f2は比例定数。 • I3(2f1)とI3(2f2)の比から偏光角gが分かる。 • I3(f1)、I3(2f1)、 I3(2f2)から円偏光と直線偏光の比tan(2c)=S3/(S12+S22)1/2が分かる。
小振幅ELMによる密度分布の崩壊、ゼーマン偏光成分の計測に成功した。小振幅ELMによる密度分布の崩壊、ゼーマン偏光成分の計測に成功した。 Liビームの発光スペクトルBt~4T σ- πσ+ フィルター特性 これらの比が磁場のピッチ角に相当する 加速電圧によるドップラーシフト 10keV 7.8keV 小振幅ELM ペデスタル 【結果】 世界で初めて小振幅ELMによる周辺密度分布の崩壊を高時間・空間分解能で捉えた。 加速電圧をスキャンしてドップラーシフトを変更し、ゼーマン偏光成分の基礎データ取得に成功した。 ⇒この手法では加速電圧を変更しても、引出電極によりビーム電流が制御できることが大きく生かされた。 【意義】 ELMによる粒子・熱流束の定量評価から、ITERにおけるダイバータ設計に大きく貢献できる。
周辺電流計測に利用するゼーマン偏光成分の検出に成功した。周辺電流計測に利用するゼーマン偏光成分の検出に成功した。 直線偏光器 観測窓 PEM レンズ 光ファイバー エタロン、フィルター の透過率 σ- πσ+ エタロン、フィルター の透過率 <ゼーマン偏光による周辺電流計測> 2つのPEM(光弾性変調器)と直線偏光器を組み合わせて、偏光成分(σ-)を光強度の周波数成分へ変換する。 【結果】 半値幅1nmの干渉フィルターと0.1nmのエタロンフィルターを組み合わせて用いることによりLiビームのゼーマン偏光成分(半値幅0.06nm)のみを取り出すことに成功した。 【特徴】 加速電圧を下げても信号強度(ビーム電流)を保つ事ができるため、 加速電圧をスキャンしてエタロンフィルターの調整が効率的に行える。 これらの比が磁場のピッチ角に相当する 加速電圧によるドップラーシフト 10keV 7.8keV
L,Hモードでのゼーマン偏光成分信号の検出に成功した。L,Hモードでのゼーマン偏光成分信号の検出に成功した。 0.8MA/3.8T, q95=7.5, d=0.5, Liビーム(7.8keV) L,H(12MW),H(15MW) 視線 直線偏光成分 LiビームOFF 【目的】 大・小振幅ELM発生時の周辺電流を観測し、周辺電流とELMの関係をからELMの物理機構を解明する。 【結果】 周辺電流計測の基礎データとなるゼーマン偏光成分のL,Hモードでの違いを得ることができ、現在解析中である。 L-Hモードの差~周辺電流? 円偏光成分 Lモード Hモード12MW Hモード15MW