Slide Note
0 likes | 14 Views
Jim Tarlton is a certified application consultant with a strong background in enterprise systems, data analytics, and e-commerce. His experience in implementing SAP systems and developing custom dashboards showcases his proficiency in Business Intelligence. With a focus on real-time analytics and frameworks like SAP REST API and Lumira, Jim excels in delivering insightful dashboards at the executive, regional, and local levels. His expertise extends to UI/UX design, data analytics, and modern web development tools like Node.js and WebSockets.

E N D
Business Intelligence Dashboards By Jim Tarlton, IV, M.S. Certified application consultant https://jimtarlton.com/
2013 – 2015 Background 2015 Educational Experience Degrees M.S. of Computer & Information Sciences, ETSU 2019 B.A. of Computer Science, LRU 2017 B.A. of Information Technologies, LRU 2017 A.A.S. of Web Technologies, CCCTI 2012 Concentrations Enterprise Systems Software Engineering Web technologies Professional Experience Enterprise Systems Implementation Data Analytics Ecommerce 2015 – 2017 2017 – 2019 2019 2018 – current
2015 Enterprise Technologies Internal Audit Risk Analysis Segregation of Duties 2015 – 2017 Certifications SAP Certified Application Associate – (04/2019) Business Process Integration with SAP S/4HANA 1709 (see here) Google Professional Certificates – (06/2021 – 02/2022) Google UX Design (see here) Google Data Analytics (see here) Plant Maintenance Human Relations CRM 2018 – present Human Relations Document Management Materials Management Professional Experience CNS, LLC; Y-12 National Security Complex – Oak Ridge, TN ABAP development (GUI reports with drilldowns) Lumira Dashboards (BOBJ and HANA designer) Human Relations implementation Procurement & Supply Chain implementation Document Management implementation 2021 – present UX Design Data Analytics Planned Training • DevOps Cloud • Project Management
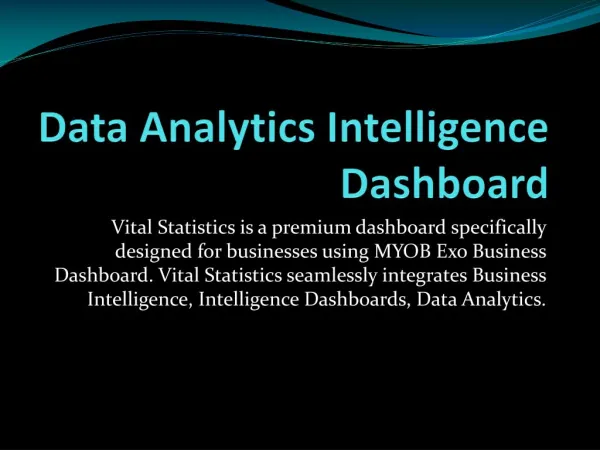
Demo GOAC, Co. USA Dashboard
GOAC Co. USA Project http://jimtarlton.com/GOAC-dashboard/ Designed ORM from SAP HANA database Fictional, national clothing company Multiple states Multiple stores per states Three primary views (drilldowns) Enterprise level Regional level Local level
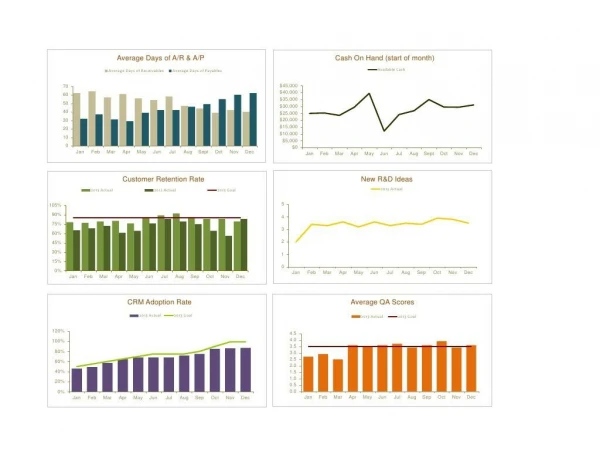
Corporate Dashboard Executive Level Metrics Focused on Financial Accounting (SAP FI) Improved decision making for executive • Real time analytics • • •
Regional Dashboard Regional Manager Metrics Improved reporting of regional stores Focused on company management accounting (SAP CO) Supports product forecasting • • • •
Local Dashboard Store Manager Metrics Improved reporting of specific stores Focused on procurement (SAP MM) Hone-in on targeted dates • • • •
Frameworks and Tools SAP REST API Create custom view table Use SAP FI BAPI Generate XML WSDL with SOAP manager Modern approach instead of using RFC Return RESTful response Convert XML to JSON format PHP for ETL module Connect to endpoint with SAP API key Consume JSON response with PHP MVC SPA web app Charts.JS and JavaScript For data visualization
Future goals and improvements Optimized real-time dashboarding Use comet streaming approach for updates WebSockets Node.JS Use SAP UI/UX standards UI5 / Fiori Lumira web apps
Demo MyIT Dashboard
MyIT Project https://jimtarlton.com/myLR 1stPlace Prize at Appalachian State University 2015 AppHack Major League Hacking competition Sponsored by Dell Computers 24 hour long coding competition Started as a data visualization tool for campus wide statistics WiFi strength Wireless Projector APIs Continuation of project involved additional campus statistics and CMS Buildings’ energy consumption IT general maintenance
Frameworks and Tools ETL Manually generated SQL insertions (GUI module pending) Endpoints with PHP MySQL database for OLTP REST API for OLAP Data binding Two-way data-binding Long polling (web-sockets alternative) “Comet” approach, for real-time dashboard UI and UX Bootstrap for quick and simplified design patterns jQuery for animations (e.g., fading and transformations) Streamlines data visualization Filters and autocomplete text Color coding of visual elements
{ Object Relational Mapping (ORM) Campus: “Lenoir-Rhyne University”, … Maintenance_Rating: 0.95, Buildings: [ { …. Name: “Rudisill Library”, Average_WiFi_Score: 0.75, Rooms: [ { Name: “Room 101”, Projector_IP: “192.168.2.3”, …. } ] } ] Mapping of relational database First Normal Form (1NF) denormalization API for front-end Object-Oriented logic JavaScript and JSON Inheritance Simplifies drilldown reports Encapsulation Simplifies data aggregation }
http://jimtarlton.com/ Thank you. Questions?