Download
1 / 28
280 likes | 719 Views
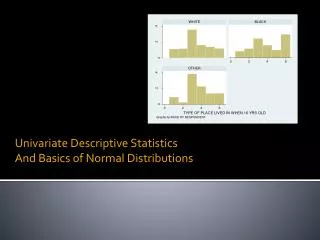
Descriptive Statistics for Spatial Distributions. Chapter 3 of the textbook Pages 76-115. Descriptive Statistics for Point Data. Also called geostatistics Used to describe point data including: The center of the points The dispersion of the points.

E N D
Descriptive Statistics for Spatial Distributions Chapter 3 of the textbook Pages 76-115
Descriptive Statistics for Point Data • Also called geostatistics • Used to describe point data including: • The center of the points • The dispersion of the points
Descriptive spatial statistics:Centrality • Assume point data. • Example types of geographic centers: • U.S. physical center • U.S. population center • Mean center • Median center
Mean Center (Centroid) • A centroid is the arithmetic mean (a.k.a. the “center of mass”) of a spatial data object or set of objects, which is calculated mathematically • In the simplest case the centroid is the geographic mean of a single object • I.e., imagine taking all the points making up the outer edge of of a polygon, adding up all the X values and all the Y values, and dividing each sum by the number of points. The resulting mean X and Y coordinate pair is the centroid. • For example: the center of a circle or square
Mean Center (Centroid) • A more complicated case is when a centroid is the geographic mean of many spatial objects • This type of centroid would be calculated using the geographic mean of all the objects in one or more GIS layer • I.e., the coordinates of each point and/or of each individual polygon centroid are used to calculate an overall mean • For example: the center of a population
Mean Center (Centroid) in Irregular Polygons • Where is the centroid for the following shapes? • In these cases the true centroid is outside of the polygons
Measures of Central Tendency – Arithmetic Mean • A standard geographic application of the mean is to locate the center (centroid) of a spatial distribution • Assign to each member a gridded coordinate and calculating the mean value in each coordinate direction --> Bivariate mean or mean center • This measure minimizes the squared distances • For a set of (x, y) coordinates, the mean center is calculated as:
Weighted Mean Center • Calculated the same as the normal mean center, but with an additional Z value multiplied by the X and Y coordinates • This would be used if, for example, the points indicated unequal amounts (e.g., cities with populations)
Manhattan Median • The point for which half of the distribution is to the left, half to the right, half above and half below • For an even number of points there is no exact solution • For an odd number of points the is an exact solution • The solution can change if we rotate the axes • May also called the bivariate median
Manhattan Median Equation • The book describes this as something created graphically (e.g., drawing lines between points) • However it can be calculated by using the median X and Y values • If there are an even number of points the Manhattan median is actually a range
Euclidian Median • The point that minimizes aggregate distance to the center • For example: if the points were people and they all traveled to the a single point (the Euclidian Median), the total distance traveled would be minimum • May also called the point of Minimum Aggregate Travel (MAT) or the median center
Euclidian Median • Point that minimizes the sum of distances • Must be calculated iteratively • Iterative calculations: • When mathematical solutions don’t exist. • Result from one calculation serves as input into next calculation. • Must determine: • Starting point • Stopping point • Threshold used to stop iterating • This may also be weighted in the same way we weight values for the mean center
Measures of Central Tendency • How do they differ? • Mean center: • Minimizes squared distances • Easy to calculate • Affected by all points • Manhattan Median: • Minimizes absolute deviations • Shortest distances when traveling only N-S and/or E-W • Easy to calculate • No exact solution for an even number of points • Euclidian Median: • True shortest path • Harder to calculate (and no exact solution)
Dispersion: Standard Distance • Standard distance • Analogous to standard deviation • Represented graphically as circles on a 2-D scatter plot
Dispersion (not discussed in textbook) • Average distance • Often more interesting • Distances are always positive, so average distance from a center point is not 0. • Relative distance • Standard distance is measured in units (i.e. meters, miles). • The same standard distance has very different meanings when the study area is one U.S. state vs. the whole U.S. • Relative distance relates the standard distance to the size of the study area.
Dispersion: Quartilides • Quartilides are determined like the Manhattan median, but for only X or Y, not both • Similar to quantiles (e.g., percentiles and quartiles) from chapter 2, but in 2-D • Examples: Northern, Southern, Eastern, Western
Pattern Analysis • This will be discussed in greater detail later in the class, but some of these measures start hinting at things like clustering
Directional Statistics • Directional statistics are concerned with… • Characterizing and quantifying direction is challenging, in part, because 359 and 0 degrees are only one degree apart • To deal with this we often use trigonometry to make measurements easier to use • For example, taking the cosine of a slope aspect measurement provides an indication of north or south facing
Directional Graphics • Circular histogram • Bins typically assigned to standard directions • 4 – N, S, E, W • 8 – N, NE, E, SE, S, SW, W, NW • 16 – N, NNE, NE, ENE, E, ESE, SE, SSE, S, SSW, SW, WSW, W, WNW, NW, NNW • Rose diagram • May used radius length or area (using radius ^0.5) to indicate frequency
Directional Statistics • Directional Mean • Assumes all distances are equal • Calculates a final direction angle • An additional equation is required to determine the quadrant • Derived using trigonometry • Unstandardized variance • Tells the final distance, but not the direction • Circular Variance • Based on the unstandardized variance • Gives a standardized measure of variance • Values range from 0 to 1, with 1 equaling a final distance of zero
Problems Associated With Spatial Data • Boundary Problem • Scale Problem • Modifiable Units Problem • Problems of Pattern
Boundary Problem • Can someone give me a concise definition of the boundary problem? • Which of these boundaries are “correct” and why? • How can we improve the boundaries?
Scale Problem • Also referred to as the aggregation problem • When scaling up, detail is lost • Scaling down creates an ecological fallacy
Modifiable Units Problem • Also called the Modifiable Area Units Problem (MAUP) • Similar to scaling problems because they also involve aggregation • The take home message is that how we aggregate the input units will impact the values of the output units • A real world example of this is Gerrymandering voting districts
Problems of Pattern • This “problem” relates to the limitations of some statistics (e.g., LQ, CL, Lorenz Curves) • Fortunately there are many other types of statistics that can be used in addition to or instead of these limited measured (e.g., pattern metrics)
For Monday • Read pages 145-164