Download
1 / 59
590 likes | 638 Views
Join the RancherK8s Master Class Series to learn Kubernetes basics, troubleshooting techniques, and component details for efficient cluster management. Explore etcd, kube-apiserver, kube-controller-manager, kube-scheduler, and more.

E N D
Troubleshooting KubernetesKubernetes Master Class Series #Rancherk8s April 16, 2019
Sebastiaan van Steenis Support Engineer Git: @Superseb Matthew Scheer Marketing Manager @matthew_scheer #RancherK8s
Rancher Master Class Series: Trying to keep this to 40-45 minutes Questions are always welcome Use the questions tab to write your questions We may respond to all, so mark your question as private if needed. #Rancherk8s
This session is being recorded! http://youtube.com/c/rancher #Rancherk8s
Join the conversation on Slack http://slack.rancher.io #masterclass #RancherK8s
Upcoming Classes http://rancher.com/kubernetes-master-class/ #RancherK8s
Who am I • Sebastiaan van Steenis • Support Engineer • https://github.com/superseb • https://medium.com/@superseb
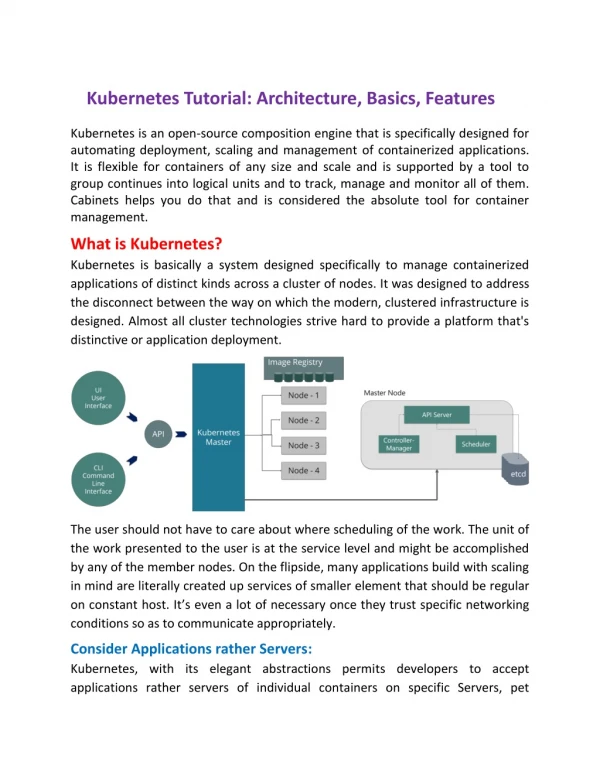
Agenda • Kubernetes basics • Troubleshooting techniques • Kubernetes components • Kubernetes resources • Note: all examples are based on Kubernetes cluster built using RKE v0.2.1 but can be used on any Kubernetes distribution with minor adjustments.
Kubernetes basics • etcd • Stores the state of the cluster • control plane (master) • kube-apiserver • front end to your cluster, interacts with state in etcd • kube-controller-manager • controllers that ensure cluster is according to desired state • kube-scheduler • schedules your workloads according to requirements • worker • kubelet • cluster node agent • kube-proxy • provides networking logic for workloads
etcd • Distributed key value store • All data of Kubernetes is stored in etcd • Majority of nodes / quorum • etcd cluster of 2 is worse than 1 • Sensitive to disk write latency • Space quota • History of keyspace • Compaction & defrag
kube-apiserver • The entry point for your cluster • Uses etcd to maintain state • Active-active round-robin possible
kube-controller-manager • Controller loops for getting cluster in desired state • Commonly known controllers • Node • Replication • Endpoints • Service Account • Talks to kube-apiserver • One active per cluster, using leader election
kube-scheduler • Schedules pods according to requirements (resource/label/taints etc) • Talks to kube-apiserver • One active per cluster, using leader election
Troubleshooting techniques • Collect • Collect current state • https://github.com/rancher/system-tools • https://github.com/rancher/logs-collector • If need to recover as soon as possible, and processes seem to hang, collect goroutines using kill -s SIGABRT $PID • Timeline of events • Retrieve data from tools interacting with cluster and from depending infrastructure • Monitoring/trending data
Troubleshooting techniques • Assess • What error/logging is shown • Search existing issues • Relate timestamps from logging to events from timeline • What triggered this situation/what changed • Does it affect everything or a certain part (hardware/datacenter/region/availability zone) • How does this differ from your baseline/tests
Troubleshooting techniques • Fix • Compare working and non-working components/resources • Isolate the issue • Test components directly • (Temporarily) remove affected node from pool • Stop the component to make sure you are talking to the right component (IP change or duplicate IP) • Apply workaround/fix found in existing issue • Reproduce in test environment
Troubleshooting techniques • Follow up • Second most important step • What was the root cause • What situation was caught or not caught • What could be recovered/replaced automatically • What took the most time
Troubleshooting etcd • Check etcd members (this is not a live view) • Check endpoint health (this is a live view) # docker exec etcdetcdctl member list 2e40f74444dd07db, started, etcd-46.101.11.169, https://46.101.11.169:2380, https://46.101.11.169:2379,https://46.101.11.169:4001 51f47c0d9a3a4102, started, etcd-206.189.17.113, https://206.189.17.113:2380, https://206.189.17.113:2379,https://206.189.17.113:4001 a2999333d29ae2be, started, etcd-206.189.17.249, https://206.189.17.249:2380, https://206.189.17.249:2379,https://206.189.17.249:4001 # docker exec etcdetcdctl endpoint health --endpoints=$(docker exec etcd /bin/sh -c "etcdctl member list | cut -d, -f5 | sed -e 's/ //g' | paste -sd ','") https://206.189.17.113:2379 is healthy: successfully committed proposal: took = 5.919455ms https://46.101.11.169:2379 is healthy: successfully committed proposal: took = 2.990428ms https://206.189.17.249:2379 is healthy: successfully committed proposal: took = 2.431935ms
Troubleshooting etcd • Check etcd endpoint status # docker exec etcdetcdctl endpoint status --endpoints=$(docker exec etcd /bin/sh -c "etcdctl member list | cut -d, -f5 | sed -e 's/ //g' | paste -sd ','") --write-out table +----------------------------+------------------+---------+---------+-----------+-----------+-----------| ENDPOINT | ID | VERSION | DB SIZE | IS LEADER | RAFT TERM | RAFT INDEX +----------------------------+------------------+---------+---------+-----------+-----------+------------ | https://142.93.44.61:2379 | faf643f068b0647 | 3.2.24 | 672 MB | true | 3 | 9706 | | https://209.97.191.90:2379 | bc893abbb1625170 | 3.2.24 | 670 MB | false | 3 | 9706 | | https://167.99.207.94:2379 | db21b4df1f0854de | 3.2.24 | 646 MB | false | 3 |. 9707 | +----------------------------+------------------+---------+---------+-----------+-----------+------------+
Troubleshooting etcd • Check etcd logging (docker logs etcd) • health check for peer xxx could not connect: dial tcp IP:2380: getsockopt: connection refused • A connection to the address shown on port 2380 cannot be established. Check if the etcd container is running on the host with the address shown. • xxx is starting a new election at term x • The etcd cluster has lost it’s quorum and is trying to establish a new leader. This can happen when the majority of the nodes running etcd go down/unreachable. • connection error: desc = "transport: Error while dialing dial tcp 0.0.0.0:2379: i/o timeout"; Reconnecting to {0.0.0.0:2379 0 <nil>} • The host firewall is preventing network communication. • rafthttp: request cluster ID mismatch • The node with the etcd instance logging rafthttp: request cluster ID mismatch is trying to join a cluster that has already been formed with another peer. The node should be removed from the cluster, and re-added. • rafthttp: failed to find member • The cluster state (/var/lib/etcd) contains wrong information to join the cluster. The node should be removed from the cluster, the state directory should be cleaned and the node should be re-added.
etcd • Compaction and defrag • Check logging • mvcc: database space exceeded • Check alarm status • Compact # docker exec etcdetcdctl alarm list memberID:xalarm:NOSPACEmemberID:xalarm:NOSPACEmemberID:xalarm:NOSPACE rev=$(docker exec etcdetcdctl endpoint status --write-out json | egrep -o '"revision":[0-9]*' | egrep -o '[0-9]*') docker exec etcdetcdctl compact "$rev” compacted revision xxx
etcd • Compaction and defrag • Defrag • Disarm alarm docker exec etcdetcdctl defrag --endpoints=$(docker exec etcd /bin/sh -c "etcdctl member list | cut -d, -f5 | sed -e 's/ //g' | paste -sd ',’”) Finished defragmenting etcd member[https://IP:2379] Finished defragmenting etcd member[https://IP:2379] Finished defragmenting etcd member[https://IP:2379] docker exec etcdetcdctl alarm disarm docker exec etcdetcdctl alarm list <empty>
etcd • Configure loglevel to be DEBUG • Restore loglevel to be INFO # curl -XPUT -d '{"Level":"DEBUG"}' --cacert $(docker exec etcdprintenv ETCDCTL_CACERT) --cert $(docker exec etcdprintenv ETCDCTL_CERT) --key $(docker exec etcdprintenv ETCDCTL_KEY) https://localhost:2379/config/local/log 2019-04-15 14:48:07.760809 N | etcdserver/api/etcdhttp: globalLogLevel set to "DEBUG" # curl -XPUT -d '{"Level":"INFO"}' --cacert $(docker exec etcdprintenv ETCDCTL_CACERT) --cert $(docker exec etcdprintenv ETCDCTL_CERT) --key $(docker exec etcdprintenv ETCDCTL_KEY) https://localhost:2379/config/local/log 2019-04-15 14:48:07.760809 N | etcdserver/api/etcdhttp: globalLogLevel set to "DEBUG"
etcd • Metrics • Available at https://127.0.0.1:2379/metrics • Slow disk • wal_fsync_duration_seconds (99% under 10 ms) • A wal_fsync is called when etcd persists its log entries to disk before applying them. • backend_commit_duration_seconds (99% under 25 ms) • A backend_commit is called when etcd commits an incremental snapshot of its most recent changes to disk. • Leader changes • https://coreos.com/etcd/docs/latest/metrics.html
etcd # curl -s --cacert $(docker exec etcdprintenv ETCDCTL_CACERT) --cert $(docker exec etcdprintenv ETCDCTL_CERT) --key $(docker exec etcdprintenv ETCDCTL_KEY) https://localhost:2379/metrics | grep wal_fsync_duration_seconds # HELP etcd_disk_wal_fsync_duration_seconds The latency distributions of fsync called by wal. # TYPE etcd_disk_wal_fsync_duration_seconds histogram etcd_disk_wal_fsync_duration_seconds_bucket{le="0.001"} 3873 etcd_disk_wal_fsync_duration_seconds_bucket{le="0.002"} 4287 etcd_disk_wal_fsync_duration_seconds_bucket{le="0.004"} 4409 etcd_disk_wal_fsync_duration_seconds_bucket{le="0.008"} 4478 etcd_disk_wal_fsync_duration_seconds_bucket{le="0.016"} 4495 etcd_disk_wal_fsync_duration_seconds_bucket{le="0.032"} 4496 etcd_disk_wal_fsync_duration_seconds_bucket{le="0.064"} 4496 etcd_disk_wal_fsync_duration_seconds_bucket{le="0.128"} 4496 etcd_disk_wal_fsync_duration_seconds_bucket{le="0.256"} 4496 etcd_disk_wal_fsync_duration_seconds_bucket{le="0.512"} 4496 etcd_disk_wal_fsync_duration_seconds_bucket{le="1.024"} 4496 etcd_disk_wal_fsync_duration_seconds_bucket{le="2.048"} 4496 etcd_disk_wal_fsync_duration_seconds_bucket{le="4.096"} 4496 etcd_disk_wal_fsync_duration_seconds_bucket{le="8.192"} 4496 etcd_disk_wal_fsync_duration_seconds_bucket{le="+Inf"} 4496 etcd_disk_wal_fsync_duration_seconds_sum 3.3282152020000026 etcd_disk_wal_fsync_duration_seconds_count 4496
etcd # curl -s --cacert $(docker exec etcdprintenv ETCDCTL_CACERT) --cert $(docker exec etcdprintenv ETCDCTL_CERT) --key $(docker exec etcdprintenv ETCDCTL_KEY) https://localhost:2379/metrics | grep ^etcd_server_leader_changes_seen_total etcd_server_leader_changes_seen_total 1
kube-apiserver • Check etcd connectivity/responsesiveness • kube-apiserver -> each etcd server • Configured as --etcd-servers in kube-apiserver parameters
kube-apiserver # for etcdserver in $(docker inspect kube-apiserver --format='{{range .Args}}{{.}}{{"\n"}}{{end}}' | grep etcd-servers | awk -F= '{ print $2 }' | tr ',' '\n'); do SSLDIR=$(docker inspect kube-apiserver --format '{{ range .Mounts }}{{ if eq .Destination "/etc/kubernetes" }}{{ .Source }}{{ end }}{{ end }}'); echo "Validating connection to ${etcdserver}/health"; curl -w '\nConnect:%{time_connect}\nStart Transfer: %{time_starttransfer}\nTotal: %{time_total}\nResponse code: %{http_code}\n' --cacert $SSLDIR/ssl/kube-ca.pem --cert $SSLDIR/ssl/kube-apiserver.pem --key $SSLDIR/ssl/kube-apiserver-key.pem "${etcdserver}/health"; done Validating connection to https://206.189.17.113:2379/health {"health": "true"} Connect:0.001 Start Transfer: 0.104 Total: 0.104 Response code: 200 Validating connection to https://206.189.17.249:2379/health {"health": "true"} Connect:0.001 Start Transfer: 0.103 Total: 0.103 Response code: 200 Validating connection to https://46.101.11.169:2379/health {"health": "true"} Connect:0.001 Start Transfer: 0.143 Total: 0.143 Response code: 200
kube-apiserver • Check kube-apiserver responsiveness • Can be executed from workstation or any node to test network between node and kube-apiserver (non controlplane nodes use nginx-proxy to connect to kube-apiserver) # for cip in $(kubectl get nodes -l "node-role.kubernetes.io/controlplane=true" -o jsonpath='{range.items[*].status.addresses[?(@.type=="InternalIP")]}{.address}{"\n"}{end}'); do kubectl --kubeconfigkube_config_cluster.yml --server https://${cip}:6443 get nodes -v6 2>&1 | grep round_trippers; done I0416 11:49:50.522678 4876 round_trippers.go:438] GET https://178.128.160.134:6443/api/v1/nodes?limit=500 200 OK in 69 milliseconds I0416 11:49:50.673302 4878 round_trippers.go:438] GET https://206.189.25.205:6443/api/v1/nodes?limit=500 200 OK in 74 milliseconds
kube-controller-manager • Find current leader # kubectl -n kube-system get endpoints kube-controller-manager -o jsonpath='{.metadata.annotations.control-plane\.alpha\.kubernetes\.io/leader}' {"holderIdentity":"seb-doctl-ubuntu-5_96fb83ba-6023-11e9-a7a7-429a019f0230","leaseDurationSeconds":15,"acquireTime":"2019-04-16T08:42:57Z","renewTime":"2019-04-16T10:36:25Z","leaderTransitions":1}
kube-scheduler • Find current leader # kubectl -n kube-system get endpoints kube-scheduler -o jsonpath='{.metadata.annotations.control-plane\.alpha\.kubernetes\.io/leader}' {"holderIdentity":"seb-doctl-ubuntu-5_1ceba614-6019-11e9-b965-429a019f0230","leaseDurationSeconds":15,"acquireTime":"2019-04-16T08:43:00Z","renewTime":"2019-04-16T10:37:09Z","leaderTransitions":1}
kubelet • Check kubelet logging • As this is the node agent, it will contain the most information regarding operations that it is executing based on scheduling requests • Check kubelet stats • For example, nodefs or imagefs stats regarding DiskPressure # curl -sLk --cacert /etc/kubernetes/ssl/kube-ca.pem --cert /etc/kubernetes/ssl/kube-node.pem --key /etc/kubernetes/ssl/kube-node-key.pem https://127.0.0.1:10250/stats
Generic • Get pods • Is state Running and how many Restarts? • Check Liveness/Readiness probes • Logs • Logging usually shows (depends on app) why it can’t start properly (or why it is not able to respond to the Liveness/Readiness probes) • Describe pods • Events shown in human readable format
Generic • Describe $resource (human readable output of parameters of a resource) • kubectl describe pod $pod Volumes: task-pv-storage: Type: PersistentVolumeClaim (a reference to a PersistentVolumeClaim in the same namespace) ClaimName: task-pv-claim ReadOnly: false default-token-zzpnj: Type: Secret (a volume populated by a Secret) SecretName: default-token-zzpnj Optional: false QoS Class: BestEffort Node-Selectors: <none> Tolerations: node.kubernetes.io/not-ready:NoExecute for 300s node.kubernetes.io/unreachable:NoExecute for 300s Events: Type Reason Age From Message ---- ------ ---- ---- ------- Warning FailedScheduling 13m (x134 over 104m) default-scheduler pod has unbound immediate PersistentVolumeClaims (repeated 4 times) Warning FailedScheduling 57s (x16 over 10m) default-scheduler pod has unbound immediate PersistentVolumeClaims (repeated 4 times)
Generic • Get events with filter $ kubectl get events --field-selector involvedObject.kind=Pod -w LAST SEEN TYPE REASON KIND MESSAGE 7m26s Normal Scheduled Pod Successfully assigned default/liveness-exec to 104.248.173.190 3m42s Normal Pulling Pod pulling image "k8s.gcr.io/busybox" 4m57s Normal Pulled Pod Successfully pulled image "k8s.gcr.io/busybox" 4m57s Normal Created Pod Created container 4m57s Normal Started Pod Started container 113s Warning Unhealthy Pod Liveness probe failed: cat: can't open '/tmp/healthy': No such file or directory 3m42s Normal Killing Pod Killing container with id docker://liveness:Container failed liveness probe.. Container will be killed and recreated.
Generic • Check Pending pods $ kubectl get pods --all-namespaces -o go-template='{{range .items}}{{if eq .status.phase "Pending"}}{{.spec.nodeName}}{{" "}}{{.metadata.name}}{{" "}}{{.metadata.namespace}}{{" "}}{{range .status.conditions}}{{.message}}{{";"}}{{end}}{{"\n"}}{{end}}{{end}} <no value> task-pv-pod default pod has unbound immediate PersistentVolumeClaims (repeated 4 times); 68.183.40.158 canal-f44ms kube-system <no value>;
Nodes • Check for differences in nodes • kubectl get nodes -o custom-columns=NAME:.metadata.name,OS:.status.nodeInfo.osImage,KERNEL:.status.nodeInfo.kernelVersion,RUNTIME:.status.nodeInfo.containerRuntimeVersion,KUBELET:.status.nodeInfo.kubeletVersion,KUBEPROXY:.status.nodeInfo.kubeProxyVersion NAME OS KERNEL RUNTIME KUBELET KUBEPROXY 139.59.160.219 Ubuntu 16.04.2 LTS 4.4.0-145-generic docker://18.9.2 v1.13.5 v1.13.5 139.59.160.44 Ubuntu 16.04.1 LTS 4.4.0-145-generic docker://18.9.2 v1.13.5 v1.13.5 178.62.104.87 Ubuntu 16.04.0 LTS 4.4.0-145-generic docker://18.9.2 v1.13.5 v1.13.5 178.62.70.37 Ubuntu 16.04.6 LTS 4.4.0-145-generic docker://18.9.2 v1.13.5 v1.13.5 188.166.157.149 Ubuntu 16.04.6 LTS 4.4.0-145-generic docker://18.9.2 v1.13.5 v1.13.5 206.189.17.113 Ubuntu 16.04.6 LTS 4.4.0-145-generic docker://18.9.2 v1.13.5 v1.13.5 206.189.17.249 Ubuntu 16.04.6 LTS 4.4.0-145-generic docker://18.9.2 v1.13.5 v1.13.5 46.101.11.169 Ubuntu 16.04.6 LTS 4.4.0-145-generic docker://18.9.2 v1.13.5 v1.13.5 46.101.17.155 Ubuntu 16.04.6 LTS 4.4.0-145-generic docker://18.9.2 v1.13.5 v1.13.5
Nodes • Check taints • kubectl get nodes -o custom-columns=NAME:.metadata.name,TAINTS:.spec.taints NAME TAINTS 139.59.160.219 <none> 139.59.160.44 <none> 178.62.104.87 [map[effect:NoSchedulekey:node-role.kubernetes.io/controlplanevalue:true]] 178.62.70.37 <none> 188.166.157.149 <none> 206.189.17.113 [map[effect:NoExecutekey:node-role.kubernetes.io/etcdvalue:true]] 206.189.17.249 [map[effect:NoExecutekey:node-role.kubernetes.io/etcdvalue:true]] 46.101.11.169 [map[effect:NoExecutekey:node-role.kubernetes.io/etcdvalue:true]] 46.101.17.155 <none> 46.101.48.172 [map[effect:NoSchedulekey:node-role.kubernetes.io/controlplanevalue:true]]
Nodes • Show node conditions • kubectl get nodes -o go-template='{{range .items}}{{$node := .}}{{range .status.conditions}}{{$node.metadata.name}}{{": "}}{{.type}}{{":"}}{{.status}}{{"\n"}}{{end}}{{end}}' $ kubectl get nodes -o go-template='{{range .items}}{{$node := .}}{{range .status.conditions}}{{$node.metadata.name}}{{": "}}{{.type}}{{":"}}{{.status}}{{"\n"}}{{end}}{{end}}' 104.248.173.190: MemoryPressure:False 104.248.173.190: DiskPressure:False 104.248.173.190: PIDPressure:False 104.248.173.190: Ready:True 104.248.175.76: MemoryPressure:False 104.248.175.76: DiskPressure:False 104.248.175.76: PIDPressure:False 104.248.175.76: Ready:True
Nodes • Show node conditions that could cause issues $ kubectl get nodes -o go-template='{{range .items}}{{$node := .}}{{range .status.conditions}}{{if ne .type "Ready"}}{{if eq .status "True"}}{{$node.metadata.name}}{{": "}}{{.type}}{{":"}}{{.status}}{{"\n"}}{{end}}{{else}}{{if ne .status "True"}}{{$node.metadata.name}}{{": "}}{{.type}}{{"}}{{.status}}{{"\n"}}{{end}}{{end}}{{end}}{{end}}' 104.248.175.76: DiskPressure:True 68.183.40.158: Ready:Unknown
Nodes • kubectl get events --field-selector involvedObject.kind=Node # kubectl get events --field-selector involvedObject.kind=Node -w LAST SEEN TYPE REASON KIND MESSAGE 0s Normal NodeNotReady Node Node 46.101.17.155 status is now: NodeNotReady
(Overlay) networking • Ports opened in (host) firewall • Overlay networking is usually UDP • Keep MTU in mind (especially across peering/tunnels) • Simple overlay network check available in Troubleshooting guide:https://rancher.com/docs/rancher/v2.x/en/troubleshooting/networking/#check-if-overlay-network-is-functioning-correctly
DNS • Check if internal cluster name resolves • kubectl run -it --rm --restart=Never busybox --image=busybox:1.28 -- nslookupkubernetes.default • Check if external name resolves • kubectl run -it --rm --restart=Never busybox --image=busybox:1.28 -- nslookup www.google.com • Simple DNS check available in Troubleshooting guide:https://rancher.com/docs/rancher/v2.x/en/troubleshooting/dns/
DNS • Check upstream DNS nameservers $ kubectl -n kube-system get pods -l k8s-app=kube-dns --no-headers -o custom-columns=NAME:.metadata.name,HOSTIP:.status.hostIP | while read pod host; do echo "Pod ${pod} on host ${host}"; kubectl -n kube-system exec $pod -c kubedns cat /etc/resolv.conf; done Pod kube-dns-58bd5b8dd7-6rv6n on host 104.248.175.76 nameserver 67.207.67.3 nameserver 67.207.67.2 Pod kube-dns-58bd5b8dd7-frdnd on host 178.128.40.200 nameserver 67.207.67.3 nameserver 67.207.67.2 Pod kube-dns-58bd5b8dd7-thxxp on host 104.248.173.190 nameserver 67.207.67.3 nameserver 67.207.67.2
Ingress • Ingress controller (NGINX by default in RKE) • https://github.com/kubernetes/ingress-nginx/blob/master/docs/how-it-works.md Load balancer Pods Node(s) with NGINX ingress controller Internet
Ingress • Check responsiveness of Ingress Controller $ kubectl -n ingress-nginx get pods -l app=ingress-nginx -o custom-columns=POD:.metadata.name,NODE:.spec.nodeName,IP:.status.podIP --no-headers | while read ingresspodnodenamepodip; do echo "=> Testing from ${ingresspod} on ${nodename} (${podip})"; curl -o /dev/null --connect-timeout 5 -s -w 'Connect: %{time_connect}\nStart Transfer: %{time_starttransfer}\nTotal: %{time_total}\nResponse code: %{http_code}\n' -k http://${podip}/healthz; done => Testing from nginx-ingress-controller-2qznb on 104.248.175.76 (104.248.175.76) Connect: 0.000000 Start Transfer: 0.000000 Total: 0.004215 Response code: 000 => Testing from nginx-ingress-controller-962mb on 178.128.40.200 (178.128.40.200) Connect: 0.019350 Start Transfer: 0.033347 Total: 0.033375 Response code: 200 => Testing from nginx-ingress-controller-b6mbm on 104.248.173.190 (104.248.173.190) Connect: 0.018494 Start Transfer: 0.033042 Total: 0.033054 Response code: 200 => Testing from nginx-ingress-controller-rwc8c on 209.97.186.23 (209.97.186.23) Connect: 1.014434 Start Transfer: 1.238128 Total: 1.238158 Response code: 200
Ingress • Check responsiveness Ingress controller -> pods => Testing from nginx-ingress-controller-226mt on 68.183.41.224 (68.183.41.224) ==> Found host foo.bar.com with service nginx in default ==> Connecting to 10.42.7.2 on 68.183.35.106 Connect:0.001761 Start Transfer: 0.002880 Total: 0.003034 Response code: 200 OK => Testing from nginx-ingress-controller-9krxk on 68.183.39.13 (68.183.39.13) ==> Found host foo.bar.com with service nginx in default ==> Connecting to 10.42.7.2 on 68.183.35.106 Connect:0.002074 Start Transfer: 0.002621 Total: 0.002793 Response code: 200 OK => Testing from nginx-ingress-controller-b6c7g on 68.183.43.181 (68.183.43.181) ==> Found host foo.bar.com with service nginx in default ==> Connecting to 10.42.7.2 on 68.183.35.106 Connect:0.001814 Start Transfer: 0.002378 Total: 0.002476 Response code: 200 OK
Ingress • Check static NGINX config • for pod in $(kubectl -n ingress-nginx get pods -l app=ingress-nginx -o custom-columns=NAME:.metadata.name --no-headers); do kubectl -n ingress-nginx exec $pod -- cat /etc/nginx/nginx.conf; done • Output hard to diff, use checksum to find differences • for pod in $(kubectl -n ingress-nginx get pods -l app=ingress-nginx -o custom-columns=NAME:.metadata.name --no-headers); do echo $pod; kubectl -n ingress-nginx exec $pod -- cat /etc/nginx/nginx.conf | md5; done • Different checksum, eliminate instance specific and randomized lines • for pod in $(kubectl -n ingress-nginx get pods -l app=ingress-nginx -o custom-columns=NAME:.metadata.name --no-headers); do echo $pod; kubectl -n ingress-nginx exec $pod -- cat /etc/nginx/nginx.conf | grep -v nameservers | grep -v resolver | grep -v "PEM sha" | md5; done