Download
1 / 30
300 likes | 341 Views
Explore the dynamics of port divergence along the North American Eastern Seaboard, focusing on globalization, trade patterns, cargo growth, and potential hinterland divergence. Delve into factors driving port divergence and containerized traffic trends in recent years, analyzing concentration and growth trajectories across major East Coast ports. Investigate the resurgence of All Water Services, their impact on transit times, and the shift from convergence to divergence in shipping services. Gain insights into port infrastructure development, regionalization strategies, and the evolving maritime-land interface.

E N D
Port Hinterland Divergence along the North American Eastern Seaboard Jean-Paul RODRIGUE Department of Economics & Geography Hofstra University, Hempstead, New York 11549, USA Changqian GUAN Intermodal Transportation & Logistics Program, Department of Marine Transportation, U.S. Merchant Marine Academy, Kings Point, New York, USA
Ports in Proximity along the Eastern Seaboard • Globalization, Trade and Port Divergence in North America • Cargo Volume Growth and Shipping Services • Port Regionalization and Potential Port Hinterland Divergence • Conclusion: From Divergence to Convergence?
A. Globalization, Trade and Port Divergence in North America • Factors of Port Divergence • What are the main processes behind divergence? • Containerized Traffic Trends • How containerization has evolved along the East Coast in recent years? • Traffic Concentration • What is the extent of the divergence taking place?
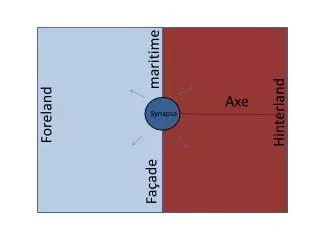
2. A Schematic Representation of the Eastern Seaboard St. Lawrence “The Funnel” Direct to the bottleneck: Montreal Upper Range “The Empty Sink” Weak handles: Halifax and Boston Mid Range “The Full Sink” Strong handles: New York and Hampton Roads Lower Range “The Filling Sink” Strong center: Charleston / Savannah Upper Range Lower Range Mid Range St. Lawrence
2. Container Traffic at Eastern Seaboard Ports, 2006 4th Tier (Niche ports) 3rd Tier (Regional Gateways) Divergence Threshold 2nd Tier (Gateways) Articulation Gateway
3. Concentration of Containerized Traffic, 1985-2006 Diffusion of Containerization Hinterland Effect
3. Concentration of Containerized Traffic, 1985-2006 (Lorenz Curve) Divergence Convergence
B. Cargo Volume Growth and Shipping Services • Traffic trend among major East Coast Ports • From convergence to divergence? • The resurgence of All Water Services • What are the underlying factors? • Service routes and transit times • How Landbridge and All Water Services compare?
1. Change in Container Traffic at Eastern Seaboard Ports 0.77 M TEU 8.36 M TEU 7.19 M TEU 1.31 M TEU +0.04 M TEU +2.01 M TEU +3.02 M TEU +0.28 M TEU
1. Strong Divergence: Montreal and Halifax Convergence Divergence Zero-sum game?
1. From Convergence to Divergence: the American East Coast (Annual Growth Rates) Divergence Convergence Divergence
2. The Resurgence of All Water Services to the East Coast Singapore Colombo Hong Kong “China Effect” Shanghai Jeddah Pusan Kobe Eastbound Route Gioia Tauro Algeciras Seattle / Vancouver Westbound Route LA/LB West Coast Congestion Landbridge Congestion Growth in the Southeast New Distribution Gateways Landbridge PanamaRoute
3. Service Routes and Transit Times: Far East to New York -1 +4 +7 +7 +12 +7
3. Service Routes and Transit Times: Far East to Norfolk, Virginia -1 +4 +7 +8 +12 +9
3. Service Routes and Transit Times: Far East to Savannah, Georgia -3 +3 +3 +4 +8 +11
3. The Resurgence of All Water Services to the East Coast Zone of Contestability NY Savannah Equilibrium (indifference) Point Eastbound Route New Direct Links 17 (2002) 26 (2007) New York (1): 75% (2005) 60% (2020) Westbound Route 3 New York (2+3): 25% (2005) 40% (2020) 1 Landbridge 2 PanamaRoute
3. Service Time Reliability to the EC: All Water Services vs. Transpacific / Landbridge Port congestion Offshore transshipment Transloading Unit train assembly Rail congestion Transmodal operations Road congestion Transpacific / Landbridge 18 days Port congestion Offshore transshipment Panama / Suez Delays All Water Services NY: 22 days Savannah: 21 days
3. Summary • Supply chain management • Landbridge is critical for high value cargo from East Asia due to its short total transit time. • The 7 day difference is quite critical. • Inland areas cargo (e.g. Chicago) • Landbridge still has an overall advantage. • Hong Kong and Singapore • Points of equilibrium between landbridge and all water service has a slight advantage in terms of transit time. • South Atlantic ports • All water service is very competitive. • South Atlantic ports are in a good position to compete with North-Mid Atlantic ports for hinterland markets.
C. Port Regionalization and Potential Port Hinterland Divergence • Port Infrastructure Development and Intermodal Services • What are the major infrastructure projects? • The reemergence of the “hinterland factor” • How the maritime / land interface is being modified? • Port regionalization strategies • How specific gateway ports are improving their regional hinterland access?
1. Port Infrastructure Development and Intermodal Services New York Dredging (50’) On-dock rail PIDN Hampton Roads APM Terminal Craney Island Terminal (2017) Heartland Project Charleston New Terminal (2013) Terminal upgrade Dredging (47’) Savannah New berth Improved rail yards
2. The Reemergence of the “Hinterland Factor”: Rail Gateways and Metropolitan Freight Centers • New York • 85% are local cargo • 14% is distributed by rail • Less than 1% is distributed by water • Hampton Roads • Over 47% of cargo originates or is destined for locations within Virginia • 53% of cargo are hinterland bound
2. The Reemergence of the “Hinterland Factor”: Inland Corridors
2. Heartland Corridor Project, Virginia / Chicago Current Double Stack Route (1,264 miles to Chicago) Virginia Inland Port Heartland Corridor (1,031 miles to Chicago) 28 Tunnels Modified to a 20’ 3” Clearance
D. Conclusion: Challenges and Opportunities of the New Panama Canal (New Panamax – 12,000 TEU) Singapore Colombo Hong Kong Shanghai Jeddah Pusan Kobe Suez Gioia Tauro Algeciras Eastbound Route Westbound Route LA/LB Kingston Panama
D. Conclusion: From Divergence to Convergence? • There is a divergence favoring a specific number of ports • Site: Limited number able to accommodate larger ships. • Ocean carriers: Emergence of all water services as a new dimension of standard port calls. • Port operators: Allocation of capital investment. • Policy: Ongoing privatization, albeit at a slower pace. • Hinterland: Development of rail corridors, particularly towards the Chicago hub. • Supply chain management: A stronger factor than accounted.