
Enhanced Global Ocean Tide Model DTU10 Using Extended FES2004 Dataset
The new global ocean tide model DTU10 is proposed based on an extended FES2004, utilizing 17 years of altimetry data to improve sea level residuals in shallow water regions. By merging data from TOPEX/POSEIDON and Jason-1/2, harmonic coefficients corresponding to the new model are developed and validated against tide gauge datasets. The study applies the response method to analyze tidal residuals and shows favorable results over the Northwest European Shelf region compared to existing models.

Enhanced Global Ocean Tide Model DTU10 Using Extended FES2004 Dataset
E N D
Presentation Transcript
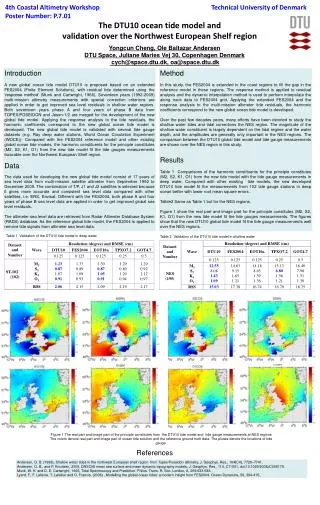
Introduction A new global ocean tide model DTU10 is proposed based on an extended FES2004 (Finite Element Solutions), with residual tide determined using the ‘response method’ (Munk and Cartwright, 1966). Seventeen years (1992-2009) multi-mission altimetry measurements with special correction criterions are applied in order to get improved sea level residuals in shallow water regions. Both seventeen years phase A and four years of phase B data from TOPEX/POSEIDON and Jason-1/2 are merged for the development of the new global tide model. Applying the response analysis to the tide residuals, the harmonic coefficients correspond to the new global ocean tide model is developed. The new global tide model is validated with several tide gauge datasets (e.g. Ray deep water stations, World Ocean Circulation Experiment (WOCE)). Compared with the FES2004 reference model and other existing global ocean tide models, the harmonic constituents for the principle constitutes (M2, S2, K1, O1) from the new tide model fit the tide gauges measurements favorable over the Northwest European Shelf region. Data The data used for developing the new global tide model consist of 17 years of sea level data from multi-mission satellite altimeter from September 1992 to December 2009. The combination of T/P, J1 and J2 satellites is selected because it gives more accurate and consistent sea level data compared with other satellites, i.e. ERS, Envisat. Different with the FES2004, both phase A and four years of phase B sea level data are applied in order to get improved global sea level residuals. The altimeter sea level data are retrieved from Radar Altimeter Database System (RADS) database. As the reference global tide model, the FES2004 is applied to remove tide signals from altimeter sea level data. Method In this study, the FES2004 is extended to the coast regions to fill the gap in the reference model in these regions. The response method is applied to residual analysis and the dynamic interpolation method is used to perform interpolate the along track data to FES2004 grid. Applying the extended FES2004 and the response analysis to the multi-mission altimeter tide residuals, the harmonic coefficients correspond to the new global ocean tide model is developed. Over the past few decades years, many efforts have been devoted to study the shallow water tides and tidal corrections the NES region. The magnitude of the shallow water constituent is largely dependent on the tidal regime and the water depth, and the amplitudes are generally only important in the NES regions. The comparison between the DTU10 global tide model and tide gauge measurements are shown over the NES region in this study. Results Table 1 Comparisons of the harmonic constituents for the principle constitutes (M2, S2, K1, O1) from the new tide model with the tide gauge measurements in deep water. Compared with other existing tide models, the new developed DTU10 tide model fit the measurements from 102 tide gauge stations in deep ocean better with lower root mean square errors . Talble2 Same as Table 1 but for the NES regions. Figure 1 show the real part and image part for the principle constitutes (M2, S2, K1, O1) from the new tide model fit the tide gauges measurements. The figures show that the new DTU10 global tide model fit the tide gauge measurements well over the NES regions. Table 1 Validation of the DTU10 tide model in deep water Table 2 Validation of the DTU10 tide model in shallow water Figure 1 The real part and image part of the principle constitutes from the DTU10 tide model and tide gauge measurements at NES regions The colors denote real part and image part of ocean tide solution and the reference ground truth data. The pluses denote the locations of tide gauge. References Andersen, O. B. (1999), Shallow water tides in the northwest European shelf region from Topex/Poseidon altimetry, J. Geophys. Res., 104(C4), 7729–7741. Andersen, O. B., and P. Knudsen, 2009, DNSC08 mean sea surface and mean dynamic topography models, J. Geophys. Res., 114, C11001, doi:10.1029/2008JC005179. Munk, W. H. and D. E. Cartwright, 1966, Tidal Spectroscopy and Prediction. Philos. Trans. R. Soc. London, A, 259:533-583. Lyard, F., F. Lefèvre, T. Letellier and O. Francis, (2006) , Modelling the global ocean tides: a modern insight from FES2004, Ocean Dynamics, 56, 394-415,.


