Download
1 / 34
340 likes | 359 Views
This article explores the significance of similarity scores in genome sequence comparison, including the use of parentheses and brackets, quotes for literals vs variables, and the use of files as arguments. It also discusses the importance of homology detection algorithms and the distribution of sequence similarity scores.

E N D
Sequence comparison: Significance of similarity scores Genome 559: Introduction to Statistical and Computational Genomics Prof. William Stafford Noble
One-minute responses • I'm confused as to when I should parentheses versus brackets. • Parentheses go with function or method names; brackets are for accessing elements in a string, list or tuple. • My main confusion is still when to use quotes or not. Parenthesis vs. brackets is easier to understand. • Use quotes on literals but not on variables. A variable is something that appears on the left side of an equals sign. • It's still a little difficult for me to think of files. Are they treated like arguments? • A file is an object that can be passed as an argument or assigned to a variable.
The more sample problems the better. I seem to always be behind everyone else in sample problems. Is that a sign I should take a more beginner level course? Enjoyed the pace and found the sample problems both satisfying and challenging. I am enjoying the course much more than I anticipated. The first part of the programming segment moved pretty fast. I definitely could have used more time to experiment with the new operations. Biostats section went well, and I enjoyed the practice problems. I liked the pace today, and the time for problems was good. The explanation for local vs. global alignments was clear. Class was a little hard to keep up with -- mostly becuase there wasn't enough typing time between in-class examples. Also, answers for HW would be nice. Problem 2 was tricky. I expected there to be some more elegant way than cutting off the last character. Lots of new programming topics, and the intro to SW was very understandable. Good pace, practice questions. I was having difficulties opening lines from different files, i.e., #3. I liked the pace of the class today and found the walkthrough of what we were going to use in the sample problems to be very helpful. I am getting a better grasp of python. The pace is great. I can't wait to know enough to write out basic programs I can use in the lab. I think more practice with reading files will be useful. I'm really starting to like python. I like the in-class python time! I feel that if I could more easily tell if a command in python refers to a variable versus actually directions that python recognizes would help me catch on quicker. Today was fine, again time for samples was OK. Great pace. I got hung up a bit on sample problem #2 but ultimately feel I have a good handle on the tools we have so far. I thought the homework was a good length and helped to reinforce and solidify in my own mind what we've learned. Good pace today. Felt fine with how I was doing.
Homework comments • RUN YOUR PROGRAM. • Use informative variable names. • Do not define extraneous variables. import sys sequence = sys.argv[1] position = int(sys.argv[2]) new_position = position – 1 print sequence[new_position] print sequence[position – 1]
Are these proteins homologs? SEQ 1: RVVNLVPS--FWVLDATYKNYAINYNCDVTYKLY L P W L Y N Y C L SEQ 2: QFFPLMPPAPYWILATDYENLPLVYSCTTFFWLF NO (score = 9) SEQ 1: RVVNLVPS--FWVLDATYKNYAINYNCDVTYKLY L P W LDATYKNYA Y C L SEQ 2: QFFPLMPPAPYWILDATYKNYALVYSCTTFFWLF MAYBE (score = 15) SEQ 1: RVVNLVPS--FWVLDATYKNYAINYNCDVTYKLY RVV L PS W LDATYKNYA Y CDVTYKL SEQ 2: RVVPLMPSAPYWILDATYKNYALVYSCDVTYKLF YES (score = 24)
Significance of scores HPDKKAHSIHAWILSKSKVLEGNTKEVVDNVLKT Homology detection algorithm 45 Low score = unrelated High score = homologs How high is high enough? LENENQGKCTIAEYKYDGKKASVYNSFVSNGVKE
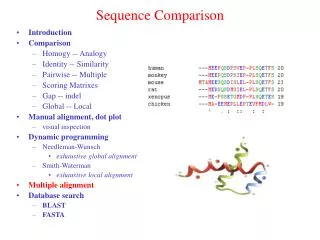
Other significance questions • Pairwise sequence comparison scores
Other significance questions • Pairwise sequence comparison scores • Microarray expression measurements • Sequence motif scores • Functional assignments of genes
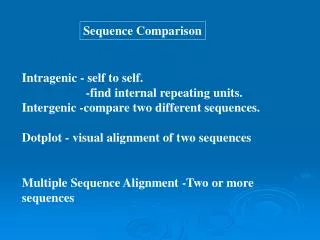
The null hypothesis • We are interested in characterizing the distribution of scores from sequence comparison algorithms. • We would like to measure how surprising a given score is, assuming that the two sequences are not related. • The assumption is called the null hypothesis. • The purpose of most statistical tests is to determine whether the observed results provide a reason to reject the hypothesis that they are merely a product of chance factors.
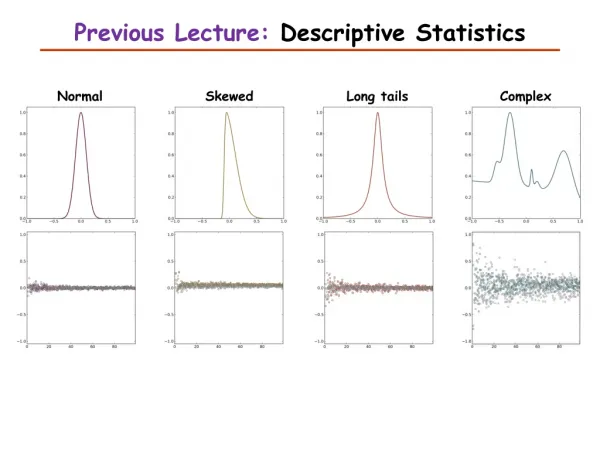
Sequence similarity score distribution ? • Search a randomly generated database of DNA sequences using a randomly generated DNA query. • What will be the form of the resulting distribution of pairwise sequence comparison scores? Frequency Sequence comparison score
Empirical score distribution • The picture shows a distribution of scores from a real database search using BLAST. • This distribution contains scores from non-homologous and homologous pairs. High scores from homology.
Empirical null score distribution • This distribution is similar to the previous one, but generated using a randomized sequence database.
Computing a p-value • The probability of observing a score >X is the area under the curve to the right of X. • This probability is called a p-value. • p-value = Pr(data|null) Out of 1685 scores, 28 receive a score of 20 or better. Thus, the p-value associated with a score of 20 is approximately 28/1685 = 0.0166.
Problems with empirical distributions • We are interested in very small probabilities. • These are computed from the tail of the distribution. • Estimating a distribution with accurate tails is computationally very expensive.
A solution • Solution: Characterize the form of the distribution mathematically. • Fit the parameters of the distribution empirically, or compute them analytically. • Use the resulting distribution to compute accurate p-values.
Extreme value distribution This distribution is characterized by a larger tail on the right.
The probability of observing a score >4 is the area under the curve to the right of 4. This probability is called a p-value. p-value = Pr(data|null) Computing a p-value
Extreme value distribution Compute this value for x=4.
Computing a p-value • Calculator keys: 4, +/-, inv, ln, +/-, inv, ln, +/-, +, 1, = • Solution: 0.018149
Scaling the EVD • An extreme value distribution derived from, e.g., the Smith-Waterman algorithm will have a characteristic mode μ and scale parameter λ. • These parameters depend upon the size of the query, the size of the target database, the substitution matrix and the gap penalties.
An example You run BLAST and get a score of 45. You then run BLAST on a shuffled version of the database, and fit an extreme value distribution to the resulting empirical distribution. The parameters of the EVD are μ = 25 and λ = 0.693. What is the p-value associated with 45?
An example You run BLAST and get a score of 45. You then run BLAST on a shuffled version of the database, and fit an extreme value distribution to the resulting empirical distribution. The parameters of the EVD are μ = 25 and λ = 0.693. What is the p-value associated with 45?
What p-value is significant? • The most common thresholds are 0.01 and 0.05. • A threshold of 0.05 means you are 95% sure that the result is significant. • Is 95% enough? It depends upon the cost associated with making a mistake. • Examples of costs: • Doing expensive wet lab validation. • Making clinical treatment decisions. • Misleading the scientific community. • Most sequence analysis uses more stringent thresholds because the p-values are not very accurate.
Multiple testing • Say that you perform a statistical test with a 0.05 threshold, but you repeat the test on twenty different observations. • Assume that all of the observations are explainable by the null hypothesis. • What is the chance that at least one of the observations will receive a p-value less than 0.05?
Multiple testing • Say that you perform a statistical test with a 0.05 threshold, but you repeat the test on twenty different observations. Assuming that all of the observations are explainable by the null hypothesis, what is the chance that at least one of the observations will receive a p-value less than 0.05? • Pr(making a mistake) = 0.05 • Pr(not making a mistake) = 0.95 • Pr(not making any mistake) = 0.9520 = 0.358 • Pr(making at least one mistake) = 1 - 0.358 = 0.642 • There is a 64.2% chance of making at least one mistake.
Bonferroni correction • Assume that individual tests are independent. (Is this a reasonable assumption?) • Divide the desired p-value threshold by the number of tests performed. • For the previous example, 0.05 / 20 = 0.0025. • Pr(making a mistake) = 0.0025 • Pr(not making a mistake) = 0.9975 • Pr(not making any mistake) = 0.997520 = 0.9512 • Pr(making at least one mistake) = 1 - 0.9512 = 0.0488
Database searching • Say that you search the non-redundant protein database at NCBI, containing roughly one million sequences. What p-value threshold should you use?
Database searching • Say that you search the non-redundant protein database at NCBI, containing roughly one million sequences. What p-value threshold should you use? • Say that you want to use a conservative p-value of 0.001. • Recall that you would observe such a p-value by chance approximately every 1000 times in a random database. • A Bonferroni correction would suggest using a p-value threshold of 0.001 / 1,000,000 = 0.000000001 = 10-9.
E-values • A p-value is the probability of making a mistake. • The E-value is the expected number of times that the given score would appear in a random database of the given size. • One simple way to compute the E-value is to multiply the p-value times the size of the database. • Thus, for a p-value of 0.001 and a database of 1,000,000 sequences, the corresponding E-value is 0.001 × 1,000,000 = 1,000. BLAST actually calculates E-values in a more complex way.
Summary • A distribution plots the frequency of a given type of observation. • The area under the distribution is 1. • Most statistical tests compare observed data to the expected result according to the null hypothesis. • Sequence similarity scores follow an extreme value distribution, which is characterized by a larger tail. • The p-value associated with a score is the area under the curve to the right of that score. • Selecting a significance threshold requires evaluating the cost of making a mistake. • Bonferroni correction: Divide the desired p-value threshold by the number of statistical tests performed. • The E-value is the expected number of times that the given score would appear in a random database of the given size.