Data Models, Representation, Transformation
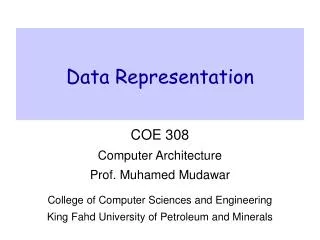
Data Models, Representation, Transformation. Design Principles Visual display Interaction. Given. Human Abilities Visual perception Cognition Memory Motor skills. Constrain design. Design Process Iterative design Design studies Evaluation. D isplays V isualization Techniques.

Data Models, Representation, Transformation
E N D
Presentation Transcript
Design Principles • Visual display • Interaction Given • Human Abilities • Visual perception • Cognition • Memory • Motor skills Constrain design • Design Process • Iterative design • Design studies • Evaluation • Displays • Visualization Techniques • Context • User • Tasks • Data types • Data Model Visualization Framework Chosen Imply Inform design Graphic adapted from Melanie Tory
Models • Talk about Data Set vs Data Models vs Conceptual Models • Examples to make clear. • Reality: you are citizen of NC and have money • Conceptual model: citizens of North Carolina and their fiscal information. • DataSet: your SSN, financial information • Data Model contains information on specific attributes of citizens of NC, with raw data mapped to specific data types. • SSN = 9 digits • Name = 80 chars • Address = 120 chars • {financial institution/amount}* = FinanceID, currency
Basic Elements of a Data Model Adapted from Stone & Zellweger • A data model represents some aspect of the world • Data models consist of these basic elements: • Entities (objects) • Attributes (values/characteristics of Entities) • Relationships between entities
Basic Elements: Entities Adapted from Stone & Zellweger • Entities are objects of interest • Places, people, movies, animals • Entities allow you to define and reason about a domain • Business • Family tree • University • Scientific model
Basic Elements: Values Adapted from Stone & Zellweger • Attributes are properties of Entities • Two major types • Quantitative • Categorical (several classes) • Appropriate visualizations often depend upon the type of the data values
Basic Elements: Relations Adapted from Stone & Zellweger • Relations relate two or more Entities • leaves are part of a plant • a department consists of employees • A person is related to another person
Common Data Types • Categorical (unordered set, supports =) • Ordinal (ordered set, supports <, >, =) • Interval (starts out as quantitative, but is made categorical by subdividing into ordered ranges) • Continuous (ordered and proportional, supports general arithmetic operators)
Categorical • unordered set • Operators: = (equality) • Also know as “Nominal” • Examples • Eye Color • Fruits • Directions: East, West, South, North • Symbols • Colors • Music Genre
Ordinal • ordered set • Operators: =, <, > • Also know as “Ordered” • Examples • Low, Medium, High • Cold, Warm, Hot • First-born, second-born, third-born, …
Interval • Boxing Weight Classes • Months: Jan, Feb, Mar, Apr, … • Binned numbers 0-9, 10-19, 20-29, … • Women’s dress sizes
Continuous • Proportional, ordered set • Operators: =, <, >, *, /, % • Also know as “Quantitative, Ratio” • Examples • Temperature • Weight • Pressure • Population • Number of words in document • Any quantities properly represented by integers or rational numbers
Dimensions of Data Type • 1D (univariate) {eye color} of students • 2D (bivariate) {eye color, hair color} of students • 3D (trivariate) {eye color, hair color, height} of students • nD (multivariate), n different attributes, for example description of cereal (homework example).
Other types of data? • Class suggest
Other data types… • Spatial/cartographic • 1D: position on line • 2D: Surface Map (surface of earth, Longitude/latitude, GPS, GIS) • 3D (Medical image, cloud volume, ocean contents) • Higher dimensions! • Time (any other data type sampled over time) • Abstract Data Structures (information constructs) which have implicit visual structures • Trees (hierarchies) • Networks (general graphs) • What else??
Relational Databases • Show relational database tables representing the data values, in parallel with conceptual model. • Company database
CUT-DDV Framework Dataset Mapping to Data Model Processed Data Represented in Data Model
CUT-DDV Framework Visualization Techniques Display Map to Display(s) Filter, Transform, Modify
Data Processing • Usually you will start with given dataset in a structured format (database tables). • However, you may have control over the acquisition of the raw data, and the mapping of raw data to the base data types in the data model. • Then you have (potentially interactive) control over • Transformations (how to produce an output form given input data values) • Filtering (choosing what to data values to display) • Extractions (selecting a subset to save out)