Download
1 / 56
560 likes | 724 Views
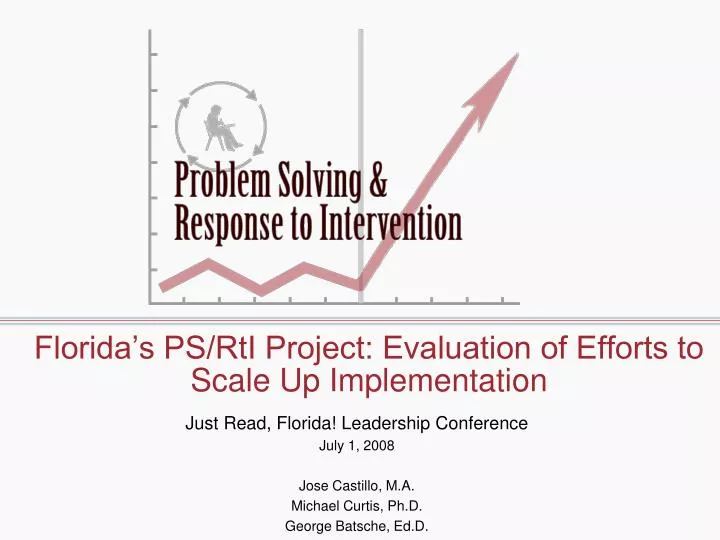
Florida’s PS/RtI Project: Evaluation of Efforts to Scale Up Implementation. Just Read, Florida! Leadership Conference July 1, 2008 Jose Castillo, M.A. Michael Curtis, Ph.D. George Batsche, Ed.D. Presentation Overview. Florida PS/RtI Project Overview Evaluation Model Philosophy

E N D
Florida’s PS/RtI Project: Evaluation of Efforts to Scale Up Implementation Just Read, Florida! Leadership Conference July 1, 2008 Jose Castillo, M.A. Michael Curtis, Ph.D. George Batsche, Ed.D.
Presentation Overview • Florida PS/RtI Project Overview • Evaluation Model Philosophy • Evaluation Model Blueprint • Examples of Data Collected • Preliminary Outcomes
The Vision • 95% of students at “proficient” level • Students possess social and emotional behaviors that support “active” learning • A “unified” system of educational services • One “ED”
State Regulations Require • Evaluation of effectiveness core instruction • Evidence-based interventions in general education • Repeated assessments in general education measuring rate changes as a function of intervention • Determination of RtI
Response to Intervention • RtI is the practice of (1) providing high-quality instruction/intervention matched to student needs and (2) using learning rate over time and level of performance to (3) make important educational decisions (Batsche et al., 2005). • Problem-solving is the process that is used to develop effective instruction/interventions.
What Does “Scaling Up” Mean? • What is the unit of analysis • Building • District • State • Region • Nation? • Scaling up cannot be considered without considering “Portability”
Portability • Student mobility rate in the United States is significant • 33% Elementary Student, 20% Middle School (NAEP) • Impact on Data • Different assessment systems/databases may limit portability • Impact on Interventions • What if interventions used for 2-3 years are not “available” in the new district, state? • Portability of systems MUST be considered when any realistic scaling up process is considered
Brief FL PS/RtI Project Description Two purposes of PS/RtI Project: • Statewide training in PS/RtI • Evaluate the impact of PS/RtI on educator, student, and systemic outcomes in pilot sites implementing the model (FOCUS TODAY)
Scope of the Project • PreK-12 (Current focus = K-5) • Tiers 1-3 • Reading • Math • Behavior
FL PS/RtI Project: Where Does It Fit? Districts must develop a plan to guide implementation of their use of PS/RtI State Project can be one component of the plan It cannot be THE plan for the district District must own their implementation process and integrate existing elements and initiate new elements
Pilot Site Overview • Through competitive application process • 8 school districts selected • 40 demonstration schools • 33 matched comparison schools • Districts and schools vary in terms of • Geographic location • Student demographics • Districts: 6,200 – 360,000 students • School, district and Project personnel work collaboratively to implement PS/RtI model
Pilot Site Overview (cont’d) • Training, technical assistance, and support provided to schools • Training provided by 3 Regional Coordinators using same format as statewide training • Regional Coordinators and PS/RtI coaches (one for each three pilot schools) provide additional guidance/support to districts and schools • Purpose = program evaluation • Comprehensive evaluation model developed • Data collected from/on: • Approximately 25-100 educators per school • Approximately 300-1200 students per school
Year 1 Focus Understanding the Model Tier 1 Applications
Behavioral Systems Academic Systems Tier 3: Intensive Interventions Individual Counseling FBA/BIP Prevent, Teach, Reinforce (PTR) Assessment-based Intense, durable procedures Tier 3: Comprehensive and Intensive Interventions Individual Students or Small Group (2-3) Reading: Scholastic Program, Reading,Mastery, ALL, Soar to Success, LeapTrack, Fundations 1-5% 1-5% Tier 2: Targeted Group Interventions Some students (at-risk) Small Group Counseling Parent Training (Behavior & Academic) Bullying Prevention Program FBA/BIP Classroom Management Techniques, Professional Development Small Group Parent Training ,Data 5-10% Tier 2: Strategic Interventions Students that don’t respond to the core curriculum Reading: Soar to Success, Leap Frog, CRISS strategies, CCC Lab Math: Extended Day Writing: Small Group, CRISS strategies, and “Just Write Narrative” by K. Robinson 5-10% Tier 1: Universal Interventions All settings, all students Committee, Preventive, proactive strategies School Wide Rules/ Expectations Positive Reinforcement System (Tickets & 200 Club) School Wide Consequence System School Wide Social Skills Program, Data (Discipline, Surveys, etc.) Professional Development (behavior) Classroom Management Techniques,Parent Training 80-90% Tier 1: Core Curriculum All students Reading: Houghton Mifflin Math: Harcourt Writing: Six Traits Of Writing Learning Focus Strategies 80-90% Three Tiered Model of School Supports - Tier I Focus Students
Change Model Consensus Infrastructure Implementation
Stages of Implementing Problem-Solving/RtI • Consensus • Belief is shared • Vision is agreed upon • Implementation requirements understood • Infrastructure Development • Problem-Solving Process • Data System • Policies/Procedures • Training • Tier I and II intervention systems • E.g., K-3 Academic Support Plan • Technology support • Decision-making criteria established • Implementation
Training Curriculum • Year 1 training focus for schools • Day 1 = Historical and legislative pushes toward implementing the PSM/RtI Model • Day 2 = Problem Identification • Day 3 = Problem Analysis • Day 4 = Intervention Development & Implementation • Day 5 = Program Evaluation/RtI • Considerable attention during Year 1 trainings is focused on improving Tier I instruction
Difference Between Evaluation & Research “Prove” “Improve” Lower Certainty Higher Relevance Higher Certainty Lower Relevance
Working Definition of Evaluation • The practice of evaluation involves the systematic collection of information about the activities, characteristics, and outcomes of programs, personnel, and products for use by specific people to reduce uncertainties, improve effectiveness and make decisions with regard to what those program, personnel, or products are doing and affecting (Patton).
Data Collection Philosophy • Data elements selected that will best answer Project evaluation questions • Demonstration schools • Comparison schools when applicable • Data collected from • Existing databases • Building • District • State • Instruments developed by the Project • Data derived from multiple sources when possible • Data used to drive decision-making • Project • Districts • Schools
FL PS/RtI Evaluation Model • IPO model used • Variables included • Levels • Inputs • Processes • Outcomes • Contextual factors • External factors • Goals & objectives
Levels • Students • Receiving Tiers I, II, & III • Educators • Teachers • Administrators • Coaches • Student and instructional support personnel • System • District • Building • Grade levels • Classrooms
Inputs (What We Don’t Control) • Students • Demographics • Previous learning experiences & achievement • Educators • Roles • Experience • Previous PS/RtI training • Previous beliefs about services • System • Previous consensus regarding PS/RtI • Previous PS/RtI infrastructure • Assessments • Interventions • Procedures • Technology
Processes (What We Do) • Students • Assessment participation (e.g., DIBELS screening) • Instruction/intervention participation • Educators • Frequency and duration of participation in PS/RtI Project training • Content of Project training in which they participated • System • Frequency & duration of professional development offered by the Project • Content of professional development offered • Stakeholders participating in professional development activities • Communication between Project and districts/buildings
Implementation Integrity Checklists • Implementation integrity measures developed • Measure • Steps of problem solving • Focus on Tiers I, II, & III • Data come from: • Permanent products (e.g., meeting notes, reports) • Problem Solving Team meetings
Outcomes (What We Hope to Impact) • Educators • Consensus regarding PS/RtI • Beliefs • Satisfaction • PS/RtI Skills • PS/RtI Practices
Tier III 5% of Students Tier II 10-15% More Students Tier I ALL STUDENTS 80-90% of Students Respond PS/RtI Model Behavior Academic T III: COMPREHENSIVE INTERVENTION: T I + T II +T IIIStudents with Intensive Needs Problem Solving and Progress Monitoring Specialized Procedures, of Longer Duration Frequent, Assessment-Based Diagnostics, Progress Monitoring, Rate of Learning T II: SUPPLEMENTAL INTERVENTION: T I + T II: Targeted Group Interventions Problem Solving to Identify Students At-Risk Implement Standard Treatment Protocol High Efficiency, Rapid Response Progress Monitoring, Rate of Learning T I: UNIVERSAL INSTRUCTION: School-Wide Systems Implement Core Instruction Universal Screening, Benchmark Assessment All Students, All Settings Preventive, Proactive
Outcomes cont. • System • PS/RtI Infrastructure • Assessments • Interventions • Procedures • Technology • Costs • PS/RtI Implementation
Outcomes cont. • Students • Academic achievement • Behavioral outcomes • Systemic • Discipline referrals • Referrals for problem solving • Referrals for SPED evaluations • SPED placements
Student Data Elements • Outcome Data • Florida Comprehensive Assessment Test (FCAT) • Grades 3-5 • Reading & Math • Stanford Achievement Test - 10 • Grades 1 & 2 where applicable • Reading & Math • Formative Data • DIBELS(targeted grade levels) • District assessments where applicable
Pilot School Example Slides from Data Meeting Following Winter Benchmarking Window
Sources of Evidence —What do our readers know? What are they able to do?
Sources of Evidence —What do our readers know? What are they able to do?