Download
1 / 36
360 likes | 510 Views
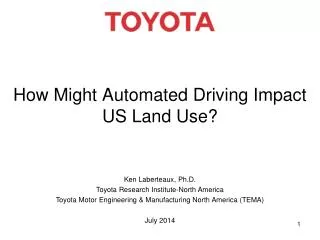
How Might Automated Driving Impact US Land Use?. Ken Laberteaux, Ph.D. Toyota Research Institute-North America Toyota Motor Engineering & Manufacturing North America (TEMA) July 2014. Prediction is very hard, especially about the future. - Yogi Berra. Predictions. Romance with car ending.

E N D
How Might Automated Driving Impact US Land Use? Ken Laberteaux, Ph.D. Toyota Research Institute-North America Toyota Motor Engineering & Manufacturing North America (TEMA) July 2014
Prediction is very hard,especially about the future.- Yogi Berra
Predictions Romance with car ending Era of abundant fuel has ended for good Middle-class returns to city, avoids cars Public Transportation Revival One occupant-per-car must end
Predictions: 1973 The Painful Change to Thinking Small, Time Magazine, Dec 31, 1973 • There have been multiplying signs that the long American romance with the big car may finally be ending. • More likely, the heavy car will linger as a limited-purpose, special-use auto, but not again become the basic American vehicle • Economists generally are agreed that the era of readily abundant fuel has ended for good. • Public transportation will experience a revival • Car pooling will have to increase…the one-occupant-per-car habit is simply too expensive to be continued. • Socially, there could be a movement of middle-class whites back to the city, where they can get away from auto dependence.
Summarizing AVS14:AD Level 2+3 and Highways • Level 2+3 currently easiest on highways, likely first locations of AD. • Predicted Impacts on highways: • Fewer accidents • Less traffic congestion • Lower environmental impact per mile • Faster average speeds
My Own Predictions • Without policy changes, in the US, Level 2+3 Automated Driving will likely: • Increase highway speeds (mostly via reduced congestion and accidents) • Increase automobile VMT • Increase commute distances (with roughly same commute time as today) • Accelerate ongoing trend towards suburbanization of homes and jobs
Across cultures and decades, people travel approx. 1.2 hrs/day Average daily travel time in hours per person as a function of GDP per capita. Source: updated dataset of Schäfer, A., D.G. Victor, 2000. The Future Mobility of the World Population, Transportation Research A, 34(3): 171-205.
For over 100 years, each new US commuting mode, offering higher speed, has increased commute distances
Suburbs are growing in every US Region US Suburbs share of population grows the last 20 yrs, in every region. [Source: W. Frey, Brookings Inst., 2012]
Growth by Metro Size “Where Americans Live: A Geographic and Environmental Tally”, A. Berger, C Brown, C. Kousky, K. Laberteaux, R. Zeckhauser, Harvard Journal of Real Estate, May 2013.
Denver 2010-2035 Employment Regional Share for comparison • Majority of jobs will soon be > 10 mi from Central Business District (CBD) • Outer suburbs only region growing in share of jobs. In Atlanta, trend is even stronger
Visualizing Why • Most models of residential location choice are hard for non-specialists to use, due to complexity and/or impractical assumptions. • I have concluded that three very important factors for housing location are • housing price, • school quality, and • commute time • Mapped these for Metropolitan Statistical Area of Chicago
Commute Time The average one-way commute time for Metro Chicago is 30 minutes. This graph shows the fraction of commuters in each zip code that have a shorter-than-average (<30 min) commute. (American Community Survey, 5-yr Avg., 2007-2001)
Do Suburbs require longer commutes? Percentage of Low Commutes (<30 min. one-way). The average percentage of low commutes (48%) represents a strong clustering value for Chicago metro area. Percentages rarely go outside of 25-75% low commutes.
Conclusions • Automated Driving Level 2+3 (NHTSA) predicted to increase travel comfort and speed, esp. on highway • Long history of Americans turning higher speed travel into more VMT, keeping total travel time same. Why would AD be different? • Increased speed offers house buyer larger area to trade-off price vs. location amenities (e.g. public school quality)
Final thought It ain’t over ‘til it’s over.- Yogi Berra
Contact Ken Laberteaux, Ph.D. Senior Principal Scientist Future Mobility Research Department Toyota Research Institute-North America Toyota Motor Engineering & Manufacturing North America, Inc. ken.laberteaux@tema.toyota.com +1-734-995-2600 www.laberteaux.org
School Quality School Quality is measured from a state-wide standardized test, with scores scaled from 0-10 (10=highest test score). Each dot indicates an elementary, middle, or high school. The larger the dot, the higher the test score for the school. The pink shading is an average of school test scores in the zip code. (Great Schools Rating, 2013)
Housing Price Shading for each zip code represents the average price of a square-foot of residential space. (Zillow Price Data, 10-yr. Median, 2003-2013)
Three Determinant Overlay Darker means more attractive to shoppers.
Example: Low-carbon Society Project (Toyota City, JP) • All 67 homes have: • PV Solar Panels • Plug-in Vehicle • Home Energy Management • House battery • Soon • Carsharing • Multi-modal navigation • Show Video
GenY drives much less Will GenY culture change car-dependent environment in US?
Gen Y: Life-cycle effect is delayed A new care-free 20s demographic creating noticeable consumer shifts, exaggerated due to economic crisis
Gen Y: Still want a Family • Gen Y: marriage and family is important, plan to get married and have children. • Will Gen Y resist economic incentives to suburbs when they start families?
Cost drives adoption rates • Which would you buy (in 2004)? • 2004 Corolla $13.5k 34 MPG • 2004 Prius $20.5k 46 MPG • At time, criticism from both sides, i.e. industry observers (bad value trade-off) and environmentalists (not green enough). • But, over 2M Prii sold, saved millions of tons CO2 Prices are minimum MSRP, MPG is EPA Combined. 2004 Prius had 3.4 cu-ft more cargo room than 2004 Corolla
Batteries Have a Long Way to Go Chevy Volt Battery 435 lb (197 kg) ≈ ≈ 37 mi 10-12 hr charge (L1) 3-4 hr charge (L2) $3.50 6 lb (2.7 kg) Compared to the same range of gas, the battery is 75 times heavier 1000 times more expensive Assumes prices of $3.50/gal of gas and at least $250/kWh for the battery