Download
1 / 25
270 likes | 418 Views
GIANT TO DWARF RATIO OF RED-SEQUENCE GALAXY CLUSTERS Abhishesh N Adhikari Mentor-Jim Annis Fermilab IPM / SDSS August 8, 2007. OUTLINE OF TALK. Introduction to SDSS The physics of my project: Giant to Dwarf Ratio in Red Galaxy Clusters MaxBCG: A cluster detection algorithm

E N D
GIANT TO DWARF RATIO OF RED-SEQUENCE GALAXY CLUSTERSAbhishesh N AdhikariMentor-Jim AnnisFermilab IPM / SDSSAugust 8, 2007
OUTLINE OF TALK • Introduction to SDSS • The physics of my project: Giant to Dwarf Ratio in Red Galaxy Clusters • MaxBCG: A cluster detection algorithm • My procedure and programming • Initial Results for the ratio and issues I had with it • Latest Results: Explanation and Conclusion • Comparing my results with the rest of the scientific community • Further Steps
INTRODUCTION TO SDSS • Sloan Digital Sky Survey is one of the most ambitious astronomical surveys ever undertaken • When complete, it will have mapped more than a 100 million objects and 25 percent of the sky • The SDSS red-shift limit for galaxies is 0.4 (a distance of a few billion light years) • The survey releases all its data on the internet and constantly updates it
GIANT TO DWARF RATIO OF RED GALAXY CLUSTERS • Galaxy • Cluster: A group of galaxies that are gravitationally bounded • Field Galaxies: Galaxies that are not a part of any cluster • Blue Galaxies: Blue, Star forming galaxies • Red Galaxies: Red, Very little star formation, bigger • Giant Galaxies: Bright galaxies • Dwarf Galaxies: Faint galaxies
GIANT TO DWARF RATIO OF RED GALAXY CLUSTERS • Luminosity Function of present day Red galaxy clusters (take note of the curve shape only)
GIANT TO DWARF RATIO OF RED GALAXY CLUSTERS • Two theories regarding the evolution of red sequence galaxy clusters: • 2) Red galaxies constantly evolve, and are formed from the merger of blue field galaxies • 1) Red Galaxies form very early on and evolve very passively afterwards
GIANT TO DWARF RATIO OF RED GALAXY CLUSTERS • Theory 2 would mean an increase in giant to dwarf ratio at higher red-shifts • Theory 1 would mean a constant giant to dwarf ratio over time
GIANT TO DWARF RATIO OF RED GALAXY CLUSTERS • Why is this important: • Theory of evolution of galaxies • Cosmological Parameters and the Large Scale Structure • Useful for other surveys
GIANT TO DWARF RATIO OF RED GALAXIES • Only a handful of people have done investigation in this particular area, the reason being there has never been a huge cluster catalog. • Nevertheless, a few people have tried to figure out if the ratio changes using a handful of clusters: • Stott et al. Compares 5 clusters • De Lucia et al. Compares 14 clusters (Both conclude increasing giant to dwarf ratio at high red-shifts) • Sloan Digital Sky Survey, with its huge database was ideal to conduct this research on a large number of clusters. • But first, we needed an algorithm of detecting red cluster galaxies in the SDSS database
MaxBCG ALGORITHM • A red-sequence galaxy cluster finding algorithm, described in Koester et al. • Based on identifying the brightest galaxy that exists at a cluster’s center • Once the center is located, search for member red-sequence galaxies using the following criteria: • A Standard Radius • Magnitude Cuts • Color Cuts (Getting just the red-sequence galaxies)
MaxBCG ALGORITHM: Color Cuts • It has been observed that red sequence cluster galaxies inhabit a tight sequence in the color-magnitude diagram. This is called the E/S0 ridgeline. • In MaxBCG color cuts, you select galaxies whose colors are within 2 sigma of the central color value of the ridgeline, where sigma is:
MaxBCG ALGORITHM • Koester had already performed the algorithm earlier on the SDSS database, and he had a list of centers (about 14000). • But his magnitude limits weren’t faint enough for us to be able to use in our project • I also did not have access to any of his codes he used for the algorithm
MY PROCEDURE • Study the theory behind the algorithm to understand how exactly it is supposed to work. • Then convert the algorithm to programming codes so that I could do something useful with it. • Extract all the cluster centers from the MaxBCG catalog (using TCL) • Use those centers and the required cuts to do a search in the SDSS database ( using SQL) to get a members catalog for the clusters • Count the number of galaxies in each of the clusters, find the required ratios and analyze
INITIAL RESULTS AND ISSUES • This was my initial result for giant to dwarf ratio vs red-shift
INITIAL RESULTS AND ISSUES • This was quite an unexpected result, and it seemed that something was going wrong
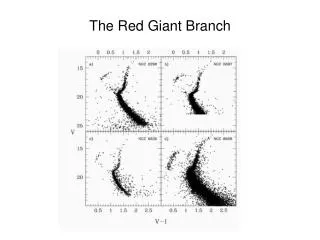
INITIAL RESULTS AND ISSUES • I re-assessed all of my procedures, and figured out that my problem existed in the color cuts. I created color-magnitude diagrams for some of my clusters
COLOR MAGNITUDE DIAGRAMS I should not have ignored the slope in the color-magnitude diagram
COLOR MAGNITUDE DIAGRAMS The error in the colors seemed to be way too high for higher redshifts
COLOR MAGNITUDE DIAGRAMS • At higher red-shifts, objects are further away, and hence they appear fainter • The fainter the object appears on the telescope, its photometric precision gets less accurate • Looking at the graph, we can’t trust the data for red-shift more than about 0.2
NEW RESULTS • After making the adjustment for the slope, and understanding that I can’t trust the data for red-shift range 0.2-0.3, I plotted the graph and got the following result
MY CONCLUSION • So ignoring data for red-shift range 0.2-0.3, and only looking at the range of 0.1 to 0.2, I came to the conclusion that there is no significant change in the giant to dwarf ratio of red galaxies in clusters at different red-shifts.
COMPARING MY RESULTS WITH OTHER PEOPLE • Weakness • My red-shift range is small (0.1 to 0.2) compared to De Lucia whose clusters range from 0.02 to 0.7 • Strength • My data is very precise. I use 14000 clusters as opposed to 10 or 20 by others
FURTHER STEPS • Background subtraction • Modifying MaxBCG algorithm to make it more efficient for my project • A better way of selecting galaxies at higher red-shifts ( 0.2 to 0.3) • Analyzing clusters with red-shifts higher than the SDSS range ( >0.4 ) • Extensive theoretical analysis of the explanation and consequences of my results