Download
1 / 20
200 likes | 402 Views
Data Warehouse. Design DataWarehouse. Key Design Considerations. it is important to consider the intended purpose of the data warehouse or business intelligence solution in order to ensure the design aligns to business requirements. Business Scenario.

E N D
Key Design Considerations • it is important to consider the intended purpose of the data warehouse or business intelligence solution in order to ensure the design aligns to business requirements.
Business Scenario • An electronics manufacturer has recently acquired a competitor to extend its existing product line. • The acquisition has provided them with an established customer base in a new geographic region that was considered for development. • The manufacturer plans future acquisitions to strengthen the current portfolio and enable growth. • While the acquisition presents new opportunities for expansion and growth, competition across existing product lines and higher raw material costs have limited their ability to expand. • In addition, the manufacturer has encountered several internal challenges that have limited growth.
The Challenges • Latency and inaccuracies in receiving sales information. • Inability to determine profitability by product and product line. • Poor quality of information. • Difficulty in forecasting sales leading to higher inventory carrying costs. • Inaccuracies in calculating sales commissions. • Needed information regarding sales, inventory levels, and manufacturing commitments to raw materials for product managers. • Use of spreadsheets in analysis of sales, manufacturing, and finance data extracted from ERP systems.
The Challenges • Difficulty in identifying root cause of manufacturing issues due to the inability to access supporting detailed data. • Inability to accurately predict the most marketable bundles of products that maximize profits, utilize excess manufacturing capacity, and reduce inventory levels. • Difficulty in satisfying the reporting needs of diverse user communities due to multiple tools, inconsistent definitions, and complexities encountered in finding and understanding data.
The Proposed Solution • The proposed solution will be used by sales, finance, and manufacturing to answer the most significant queries • Sales analysis: • What are the sales by quarter, sales representative, and geography? • How are sales trending to industry forecasts? • How do sales compare in the Northeast to Southwest?
The Proposed Solution • Product profitability: • Which product lines are the highest revenue producers this year? • Which products and product lines are the most profitable this quarter? • Which product lines are above seasonal forecasts? • Sales representative analysis: • Who are the top five sales representatives by sales volume? • Who are the most productive sales representatives in divisions, regions, and territories? • Which sales divisions, regions, and territories generate the highest revenues and margins?
The Proposed Solution • Customer analysis: • Who are the best customers? • Who are the most profitable customers? • What percentage of sales is generated from the top five customers? • Which customers purchase the most products by product line? • Which industry has experienced the fastest growth over last year?
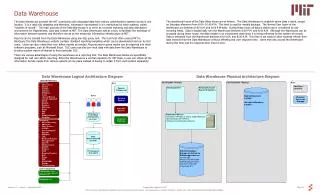
Dimensional Design • Dimensional design is a denormalization technique used in providing an intuitive view of historically correct information that corresponds to the needs of users. • Commonly referred to as star schema design, dimensional designs are subject-oriented structures comprised of fact tables and dimension tables.
Dimensional Design • Fact tables represent processes, events, or activities that are used in measuring a business. • A fact table is comprised of two types of columns: foreign key references to dimension tables and to measures. • Foreign key columns are provided to join the fact table to dimension tables that enable the filtering and constraining of data.
Dimensional Design • Dimension tables contain attributes and hierarchies that enable a logical grouping and constraining of data. • Dimension attributes are normally descriptive and represent details about the dimension. • Hierarchies within a dimension provide a natural summarization of information ranging from the lowest level of detail to the highest summary level. • The most common hierarchy in dimensional designs is the time hierarchy that provides multiple levels that typically range from day, week, and month to year.
Dimensional Design • Measures or metrics represent the information that is to be measured about a business process or event. • Measures represent information that is specific about one or more dimensional values. • In this example, the measures captured are quantity, sales, profit, and commission.
Benefit from a Hybrid Design • Flexibility to extend • Ease of use • Subject-area centric • Quality initiatives
Online Analytical Processing Design • The Oracle OLAP engine uses what is called an analytic workspace as a multidimensional data structure to support analytic processing. • When constructing our OLAP design, the analytic workspace is built by logically defining dimensions, levels, hierarchies, attributes, cubes, measures, and mappings prior to physically loading data from a relational source.
Online Analytical Processing Design • The OLAP cube provides a logical multidimensional representation used to organize metrics that share the same relationships for analysis. • The edges of a cube represent the dimensions used for filtering and constraining while the body of the cube contains one or more metrics or measures used in measuring a business process or event. • In our example, we created a sales cube that is dimensioned by time, customer, product, and sales rep in a manner similar to the dimensional model.