Download
1 / 31
310 likes | 477 Views
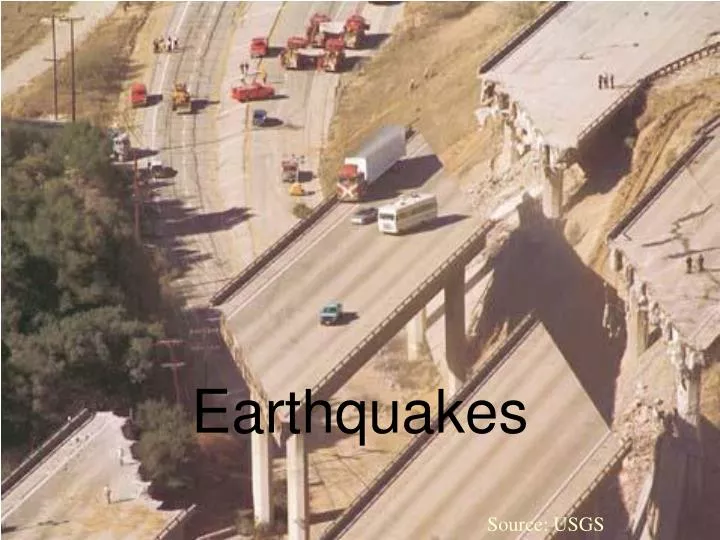
Earthquakes. Source: USGS. Source: NPS. Seismic Hazard. Source: USGS. California Tectonics: Present. Source: USGS. California Tectonics: Past. http:// www.nps.gov/prsf/naturescience/images/Subduction-animation_1.gif. What Is An Earthquake?.

E N D
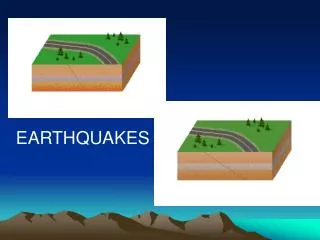
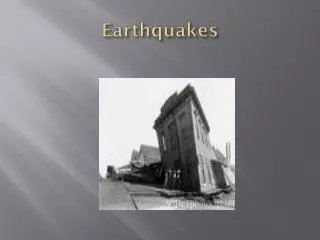
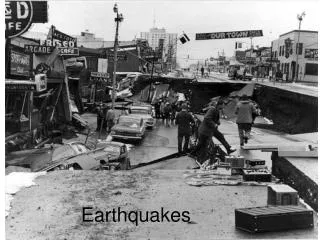
Earthquakes Source: USGS Source: NPS
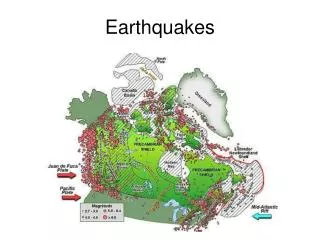
Seismic Hazard Source: USGS
California Tectonics: Present Source: USGS
http://www.nps.gov/prsf/naturescience/images/Subduction-animation_1.gifhttp://www.nps.gov/prsf/naturescience/images/Subduction-animation_1.gif
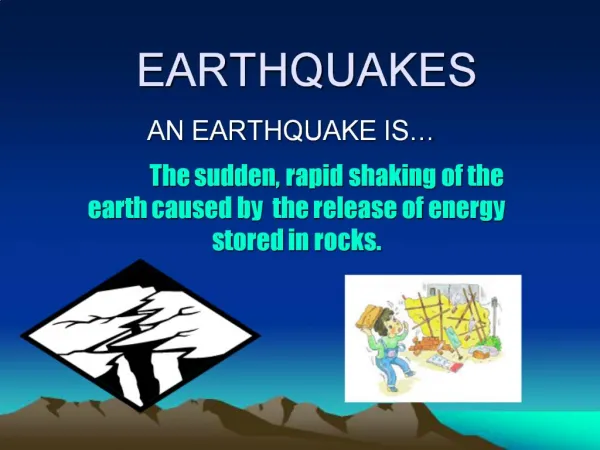
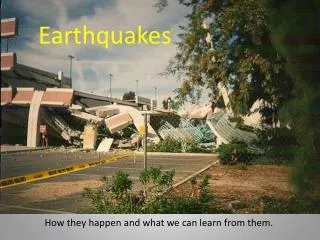
What Is An Earthquake? _______________________________________________ _______________________________________________ _______________________________________________ _______________________________________________ _______________________________________________ http://geography.sierra.cc.ca.us/booth/California/1_lithosphere/earthquakes.htm
Types of Earthquake Waves • Surface waves • Complex motion • _________________________________ • Body waves • 1. Primary (P) waves • Push-pull (__________________) motion • Travel through solids, liquids, and gases • ___________________of all earthquake waves • 2. Secondary (S) waves • "Shake" motion • Travel only through _____________ • ____________________ than P waves
A seismogram records ________________vs. _________ http://ww2.lafayette.edu/~malincol/Geol120/seismogram.GIF
Measure the difference in arrival of ____________ waves. Locating an ____________ from 3 seismograph stations
Step 2 of locating the epicenter 2. Use a graph to determine the ______________ from the monitoring station to the epicenter.
Draw a circle, centered around the monitoring station with a radius _________ to the distance from the epicenter. Repeat two more times. 5. The point where all three circles intersect is the location of the ______________. Steps 3, 4 & 5 of Locating the Epicenter
Measuring The Size of An Earthquake • ______________ – determined by effects on people, structures, and the environment • _______________ – measures energy released at the source of the earthquake.
Magnitude From Amplitude http://www.earthquakes.bgs.ac.uk/earthquakes/education/eq_booklet/dia_richter_scale.jpg
Intensity Witness observations I Felt by very few people; barely noticeable II Felt by a few people, especially on upper floors. III Noticeable indoors, especially on upper floors, but may not be recognized as an earthquake. Hanging objects swing. IV Felt by many indoors, by few outdoors. May give the impression of a heavy truck passing by. V Felt by almost everyone, some people awakened. Small objects move. Trees and poles may shake. VI Felt by everyone. Difficult to stand. Some heavy items of furniture move, plaster falls. Slight damage to chimneys possible. VII Slight to moderate damage in well-built, ordinary structures. Considerable damage to poorly built structures. Some walls may fall. VIII Little damage in specially built structures. Considerable damage to ordinary buildings, severe damage to poorly built structures. Some walls collapse. IX Considerable damage to specially built structures, buildings shifted off foundations. Noticeable cracks in ground. Wholesale destruction. Landslides. X Most masonry and frame structures and their foundations destroyed. Ground badly cracked. Landslides. Wholesale destruction. XI Total damage. Few, if any, structures standing. Bridges destroyed. Wide cracks in ground. Waves seen on ground. XII Total damage. Waves seen on ground. Objects thrown up into air. Abbreviated Modified ________ Intensity Scale
Did You Feel It? http://earthquake.usgs.gov/eqcenter/dyfi.php
________________ ________________ ________________ Ground shaking _______________ Ground Rupture Earthquake Hazards
http://www.abag.ca.gov/bayarea/eqmaps/gif99/bayas06m.gif Shaking
_________________ http://www.tulane.edu/~sanelson/images/liquefaction.gif Niigata Earthquake, Japan, 1964: Tilting of apartment buildings http://cee.uiuc.edu/sstl/education/liquefaction/Pictures/APTS.jpg
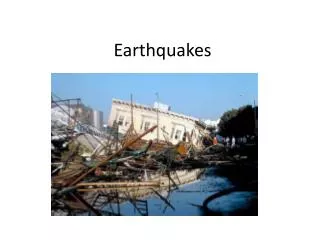
Asian Earthquake and Tsunami of 2004What Happened and Why? Magnitude 9 earthquake • Largest earthquake since the 9.2 magnitude Alaskan earthquake (1964) • Energy release equivalent of 23,000 atom bombs such as the one that destroyed Hiroshima • Why did it occur here?
Earthquakes and Tsunamis What, besides earthquakes, can cause a tsunami?
Tsunami Risk in California • California is at risk of tsunamis that are generated locally and from a distance. • 1964: 10 killed and 35 injured when tsunami from the 1964 Alaska earthquake reached Crescent City (Oregon/CA border). • A Cascadia earthquake (an earthquake up in ____________ or ____________ could bring a tsunami to Northern CA in ~ 15 minutes.
Short-term Prediction • Precursors: May or may not occur • Uplift • Foreshocks • Anomalous animal behavior • Changes in water levels in wells • Release of radon gas • Changes in velocity of P waves
Long-Range Forcasting • Based on knowledge of when and where past earthquakes have occurred. • Paleoseismology – _________________________________________ _________________________________________ • Seismic gaps- _________________________________________ _________________________________________
Bay Area EQ Probabilities Hayward – Rodgers Creek Faults have the highest probabilities Forecasting (probability) vs. prediction Source: USGS
Paleoseismology - the study of prehistoric earthquakes. http://www.tulane.edu/~sanelson/images/paleosseis.gif http://pubs.usgs.gov/fs/1999/fs152-99/images/faults.jpg
M7 1868 Hayward earthquake • 30 fatalities, 5 in San Francisco (12th most lethal US earthquake) • $350,000 (>$5-100M in 2007 dollars) in damage in San Francisco alone • Extensive damage in San Leandro, Hayward, and Fremont (total population less than 2000) • Bay Area population was 260,000 (it is now 27 times larger) Source: USGS
1868 Hayward Earthquake Source: USGS 38° 37.5° -121°
Earthquake of M > 6.8 on the Hayward Fault? • A major earthquake today on the Hayward fault • would impact more than 5 million people and • Cause estimated total economic losses to residential and commercial properties would likely exceed $165 billion. • Other factors, such as fire, damage to infrastructure and related disruption would substantially increase the loss http://www.usgs.gov/newsroom/article.asp?ID=1899&from=rss