Download
1 / 31
310 likes | 434 Views
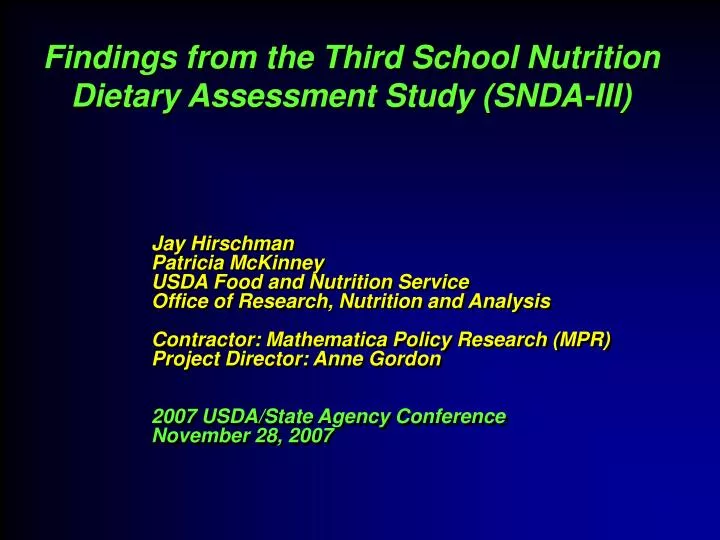
Findings from the Third School Nutrition Dietary Assessment Study (SNDA-III). Jay Hirschman Patricia McKinney USDA Food and Nutrition Service Office of Research, Nutrition and Analysis Contractor: Mathematica Policy Research (MPR) Project Director: Anne Gordon

E N D
Findings from the Third School Nutrition Dietary Assessment Study (SNDA-III) Jay Hirschman Patricia McKinney USDA Food and Nutrition Service Office of Research, Nutrition and Analysis Contractor: Mathematica Policy Research (MPR) Project Director: Anne Gordon 2007 USDA/State Agency Conference November 28, 2007
SNDA-III Part of a Long Tradition • National Evaluation of the School Nutrition Programs (NESNP-I) in 1980 was the first national study by FNS to assess the effects of school meals • SNDA-I (SY 1991-92) highlighted high fat content of school meals and helped motivate SMI. • SNDA-II (SY 1998-99) provided an early look at SMI implementation • Since SNDA-II, growing concern about child obesity and changes in standards for healthy diet (DRIs and revised Dietary Guidelines) • SNDA-III (SY 2004-05) provides updated data to assess SMI and directions for the future
Remember This?? SY1991-92 NSLP Offered 38% total fat 15% saturated fat
SNDA-III Study Design • Nationally representative of all public schools participating in the NSLP in the 48 contiguous States and DC • Data on meals offered and meals served as well as student’s 24-hour dietary intake • 129 SFAs in 36 States • 398 Schools • Approximately 2300 Students in 287 of those schools • Data collected in Spring 2005
We’ll be presenting….Offered and Served • Average Meals as Offered -- Unweighted analyses -- Equal weight to items within menu choice • Average Meals as Served (Selected by students) -- Weighted analysis -- More weight to frequently selected items
NSLP/SBP: Current Requirements for Reimbursable MealsNutrients • Nutrients in meals are averaged over a school week; weekly averages must meet regulatory standards • 1/3 of 1989 RDA for protein, calcium, iron, vitamin A and vitamin C at lunch; 1/4 of RDA for these nutrients at breakfast • Appropriate level of calories for age/grade groups • Consistent with the 1995 DGA • Limit the percent of calories from total fat to 30% of the actual number of calories offered • Limit the percent of calories from saturated fat to less than 10% of the actual number of calories offered • Reduce sodiumandcholesterol levels • Increase the level of dietary fiber
Pat “The Optimist” McKinney as The Good Cop Jay “The Pessimist” Hirschman as The Bad Cop To make this presentation more interesting, we now bring you…
Most Schools Serve Lunches that Meet Standards for Key Nutrients that Contribute to a Healthy Diet Percentage of Schools Meeting Standards Source: School Nutrition Dietary Assessment-III, Menu Survey, SY 2004-2005.
OK, Pat, that showed results for each nutrient individuallyBut…what about schools meeting ALL of the SMI nutrient standards together? • Please write down your best guess For percent as offered on average Protein + Vitamin A + Vitamin C + Calcium + Iron + Total Fat + Saturated Fat + Calories
Few Schools Met All SMI Standards for a Reimbursable Lunch Percentage of Schools Meeting Standard Only 5.7% meet all SMI standards, even with the waiver to used offered (unweighted) data SOURCE: SNDA-III, Menu Survey, school year 2004-05.
Seventy-nine Percent of Elementary SchoolsOffered Lunches that Met the Calorie Standard Percentage Meeting the Standard SOURCE: SNDA-III, Menu Survey, school year 2004-05.
Over Three-Fourths of High Schools Are Not Serving Lunches that Meet the Calorie Standards for Reimbursement Percentage NOT Meeting Standard (tall bars =worse) SOURCE: SNDA-III, Menu Survey, school year 2004-05.
Low Fat and Low Saturated Fat LunchOptions Were Widely Available Percentage of Schools Offering Students Opportunity to Select Source: School Nutrition Dietary Assessment-III, Menu Survey, SY 2004-2005.
Less than One-Third of Schools Met Standards for Reimbursable Mealsfor Total Fat or Saturated Fat Percentage of Schools Meeting Standards Source: School Nutrition Dietary Assessment-III, Menu Survey, SY 2004-2005.
Almost All Schools Satisfied the Benchmark for Cholesterol and Fiber Percentage of Schools Meeting Standards Source: School Nutrition Dietary Assessment-III, Menu Survey, SY 2004-2005. Note: Benchmarks are not requirements under SMI.
Almost All Schools Failed to Satisfy the Benchmarks for Sodium Percentage of Schools NOT Meeting the Benchmarks (tall bars = worse) Source: School Nutrition Dietary Assessment-III, Menu Survey, SY 2004-2005. Note: Benchmarks are not requirements under SMI.
Have Schools Made Progress Toward Meeting SMI Standards Since 1998-99?
A High Proportion of Elementary Schools Continue to Meet SMI Standards for Key Nutrients Served at Lunch Percentage of Elementary Schools Meeting Standards Sources: School Nutrition Dietary Assessment-III, Menu Survey, and School Nutrition Dietary Assessment-II, Menu Survey, SY 1998-99 (Fox et al. 2001).
There was No Improvement in the Proportion of Secondary Schools Meeting SMI Standards for Most Key Nutrients Served at LunchSignificantly Fewer Met the Vitamin A Standard in SNDA-III Percentage of Secondary Schools Meeting Standards 65% 60% Sources: School Nutrition Dietary Assessment-III, Menu Survey, SY 2004-05 and School Nutrition Dietary Assessment-II, Menu Survey, SY 1998-99 (Fox et al. 2001). *Difference is statistically significant at .05 level.
Average Calories from Saturated Fat Declined between SY 1998-99 and SY 2004-05 in Lunches as Served * SOURCES: SNDA-III, Menu Survey, SY 2004-05 and SNDA-II, Menu Survey, SY 1998-99. *Difference is statistically significant at 0.05 level.
AND More Schools Met Saturated Fat Standard in Lunches Servedin SY 2004-05 SOURCES: SNDA-III, Menu Survey, SY 2004-05 and SNDA-II, Menu Survey, SY 1998-99. *Difference is statistically significant at 0.05 level.
But More than Two-thirds of Schools Still Do Not Meet the Meal Reimbursement Standards for Saturated Fat Percentage of Schools NOT Meeting Standard SOURCES: SNDA-III, Menu Survey, SY 2004-05 and SNDA-II, Menu Survey, SY 1998-99. *Difference is statistically significant at 0.05 level.
Between SY 1998-99 and SY 2004-05, Average Calories from Total Fat in Lunches as Served Were Unchanged SOURCES: SNDA-III, Menu Survey, SY 2004-05 and SNDA-II, Menu Survey, SY 1998-99.
There Was No Significant Difference in the Proportion of Schools Meeting the Total Fat Standard in Lunches Served Between SY1998-99 and SY2004-05 SOURCES: SNDA-III, Menu Survey, SY 2004-05 and SNDA-II, Menu Survey, SY 1998-99.
Summary In SY 2004-05 . . . • Most schools offered and served lunches meeting SMI standards for vitamins, minerals and protein • Significantly more schools served lunches meeting standard for saturated fat than in SY 1998-99 • Less than one-third of schools offered or served lunches consistent with SMI standards for fat or saturated fat • Sodium levels in lunches served remained high
Total fat Salad dressings Condiments/spreads Pizza products Peanut butter sandwiches French fries Saturated fat Pizza products Condiments/spreads 2% milk Salad plates/salad bars Hamburgers and cheeseburgers Top Sources of Total Fat and Saturated Fat in NSLP Lunches
SNDA-III has much more informationThree volumes and a separate Consumer-friendly Summary Volume I: School Foodservice Operations, School Environment and Meals Offered and Served • menu planning system used, • characteristics of school environment (school policies on lunch time, open campus) • availability of competitive foods (vending, a la carte, other) Volume II: Student Participation and Dietary Intakes • Reasons for participation, satisfaction with school meals, characteristics of participants-nonparticipants • Dietary intake at lunch and breakfast and over 24 hours • Types of foods consumed, food sources of calories/nutrients • Frequency and sources of competitive foods • Appendices Volume III: Sampling and Data Collection
Office of Research, Nutrition and Analysis(ORNA) The SNDA-III Summary of Findings and Full Report (3 volumes) are now available on the FNS we site