Download
1 / 2
30 likes | 150 Views
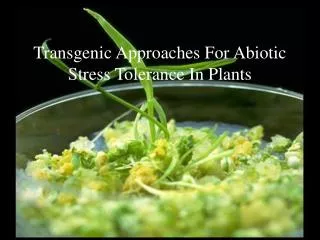
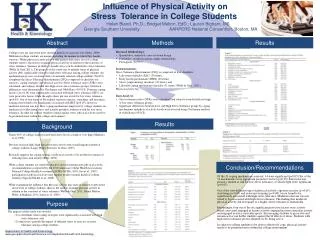
Objective. To determine how salinity and herbicide exposure affect photosynthetic performance and HSP 70 expression in the seagrass, Thalassia testudinum. Stress Tolerance in Seagrass

E N D
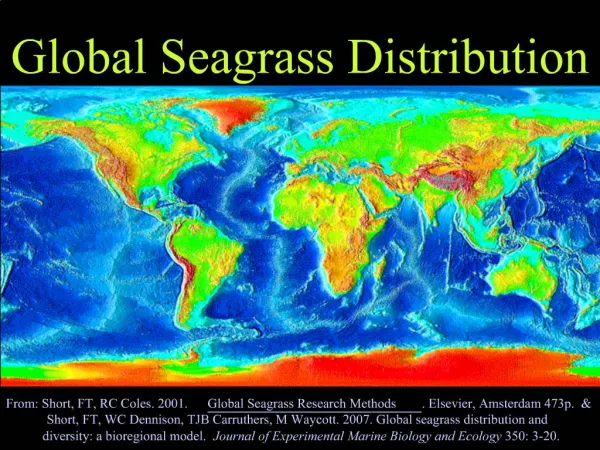
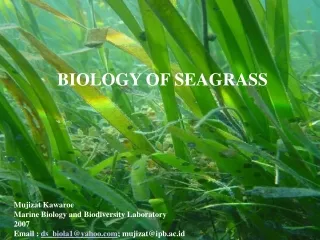
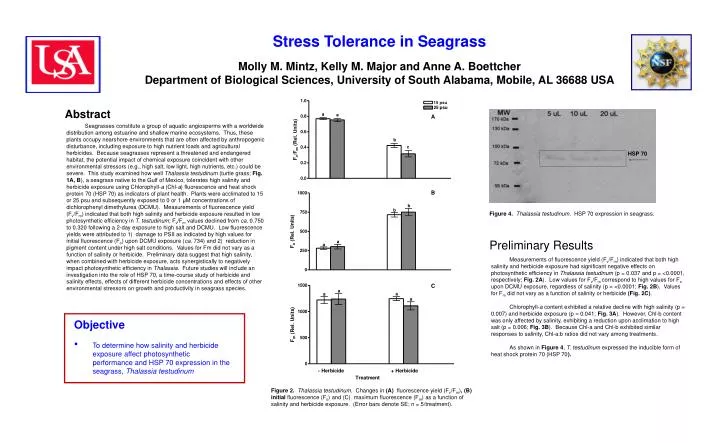
Objective • To determine how salinity and herbicide exposure affect photosynthetic performance and HSP 70 expression in the seagrass, Thalassia testudinum Stress Tolerance in Seagrass Molly M. Mintz, Kelly M. Major and Anne A. BoettcherDepartment of Biological Sciences, University of South Alabama, Mobile, AL 36688 USA Abstract A Seagrasses constitute a group of aquatic angiosperms with a worldwide distribution among estuarine and shallow marine ecosystems. Thus, these plants occupy nearshore environments that are often affected by anthropogenic disturbance, including exposure to high nutrient loads and agricultural herbicides. Because seagrasses represent a threatened and endangered habitat, the potential impact of chemical exposure coincident with other environmental stressors (e.g., high salt, low light, high nutrients, etc.) could be severe. This study examined how well Thalassia testudinum (turtle grass; Fig. 1A, B), a seagrass native to the Gulf of Mexico, tolerates high salinity and herbicide exposure using Chlorophyll-a (Chl-a) fluorescence and heat shock protein 70 (HSP 70) as indicators of plant health. Plants were acclimated to 15 or 25 psu and subsequently exposed to 0 or 1 μM concentrations of dichlorophenyl dimethylurea (DCMU). Measurements of fluorescence yield (Fv/Fm) indicated that both high salinity and herbicide exposure resulted in low photosynthetic efficiency in T. testudinum; Fv/Fm values declined from ca. 0.750 to 0.320 following a 2-day exposure to high salt and DCMU. Low fluorescence yields were attributed to 1) damage to PSII as indicated by high values for initial fluorescence (Fo) upon DCMU exposure (ca. 734) and 2) reduction in pigment content under high salt conditions. Values for Fm did not vary as a function of salinity or herbicide. Preliminary data suggest that high salinity, when combined with herbicide exposure, acts synergistically to negatively impact photosynthetic efficiency in Thalassia. Future studies will include an investigation into the role of HSP 70, a time-course study of herbicide and salinity effects, effects of different herbicide concentrations and effects of other environmental stressors on growth and productivity in seagrass species. HSP 70 B Figure 4.Thalassia testudinum. HSP 70 expression in seagrass. Preliminary Results Measurements of fluorescence yield (Fv/Fm) indicated that both high salinity and herbicide exposure had significant negative effects on photosynthetic efficiency in Thalassia testudinum (p = 0.037 and p = <0.0001, respectively; Fig. 2A). Low values for Fv/Fm correspond to high values for Fo upon DCMU exposure, regardless of salinity (p = <0.0001; Fig. 2B). Values for Fm did not vary as a function of salinity or herbicide (Fig. 2C). Chlorophyll-a content exhibited a relative decline with high salinity (p = 0.007) and herbicide exposure (p = 0.041; Fig. 3A). However, Chl-b content was only affected by salinity, exhibiting a reduction upon acclimation to high salt (p = 0.006; Fig. 3B). Because Chl-a and Chl-b exhibited similar responses to salinity, Chl-a:b ratios did not vary among treatments. As shown in Figure 4, T. testudinum expressed the inducible form of heat shock protein 70 (HSP 70). C A A Figure 2.Thalassia testudinum. Changes in (A) fluorescence yield (Fv/Fm), (B) initial fluorescence (Fo) and (C) maximum fluorescence (Fm) as a function of salinity and herbicide exposure. (Error bars denote SE; n = 5/treatment).
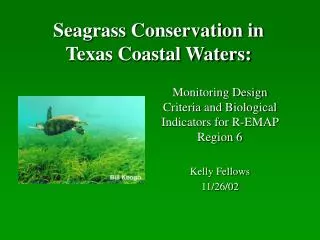
Preliminary Conclusions • The overall health of T. testudinum was negatively • affected upon exposure to either high salt or herbicide. • Deterioration in fluorescence yield was attributed to • i) damaging effect of DCMU on PSII • ii) effect of high salinity on pigment content • In contrast to previous studies on algae and other • plants, exposure to one stressor does not seem to • confer tolerance to a second stressor in T. testudinum. B B A A B Figure 1.Thalassia testudinum. (A) A view of Thalassia plants in their native habitat (http://faculty.washington.edu/gayaldo/images/thal.jpg); (B) A line drawing depicting morphological features of T. testudinum (http://www.tbep.org/pics/turtlegrass.gif). Materials and Methods Planned Research Plant Collection Thalassia testudinum plants were collected in shallow water from Gulf Islands National Seashore, Perdido Key, Florida, in late June 2005, using a shovel to dig up cores. All sediment and attached animals were removed and plants were transferred to 5-gallon buckets filled with seawater from the collection site. Plants were transferred to tanks filled with fresh seawater immediately upon return to the lab. Chlorophyll Fluorescence & Pigment Content After two days exposure, the effects of salinity (15 and 25 psu) and herbicide (1.0 μM DCMU) were assessed by measuring Chlorophyll-a (Chl-a) fluorescence using a Pulse Amplitude Modulated (PAM) fluorometer (Dive PAM, Walz). Fluorescence was measured on one randomly chosen plant per tank (n = 5 per treatment). A 1-cm section (2 cm above the sheath) on the second rank leaf of each plant was cleaned of epiphytes and dark adapted for ten minutes prior to determination of initial fluorescence (F0), maximum fluorescence (Fm) and the fluorescence yield (Fv/Fm). Immediately following fluorescence yield measurements, the same 1-cm portion of the second rank leaf was chopped with a straight-edged razor and placed in 2.5 mL of DMF (N, N’-dimethlyforamide) for later pigment analysis. Following a 7-day extraction period, pigment concentrations (Chl-a & -b) were calculated on a per area basis using traditional spectrophotometric methods and equations from Porra et al. (1982). Heat Shock Protein Analysis After four days of exposure to salinity and DCMU, the remaining plants in each tank were pooled for HSP 70 analysis. Proteins were analyzed using 8% SDS-PAGE gel electrophoresis. Western blotting was performed and proteins identified with HSP 70-specific antibodies. Following imaging, the blot was analyzed with a PC and ADOBE Photoshop 3.0 software. • Companion studies with Vallisneria americana • Investigation into the role of HSP 70 in seagrass • A time course study of herbicide and salinity effects Literature Cited Porra , R.J., Thompson, W.A. & Kriedmann, P.E. (1989) Biochimica Biophysica Acta. 975: 384-394. Figure 3.Thalassia testudinum. Changes in (A) Chl-a and (B) Chl-b concentrations as a function of salinity and herbicide exposure. (Error denote SE; n = 5/treatment). Acknowledgements Funding for this research was provided by the National Science Foundation REU Program. The authors wish to acknowledge Dr. Julio Turrens for all of his hard work and organizing the University of South Alabama’s summer REU program. We would also like to thank Dr. Timothy Sherman for his assistance and input regarding protein analysis. Finally, many thanks to Emily Boone, Melanie Caldwell, Nobuo Udea and Wesley Lumpkin for their assistance with collections and sampling related to this project.