Download
1 / 14
140 likes | 275 Views
This work presents a novel object-oriented verification approach for quantitative precipitation forecasting (QPF). Traditional verification methods often reduce rich datasets into summarized statistics that can obscure meaningful details. Instead, our method decomposes forecast and observed fields into identifiable objects, employing image processing and data mining techniques. By characterizing these objects, including their attributes and spatial structures, we produce similarity scores that provide deeper insights into forecast realism, enhancing the understanding of meteorological events.

E N D
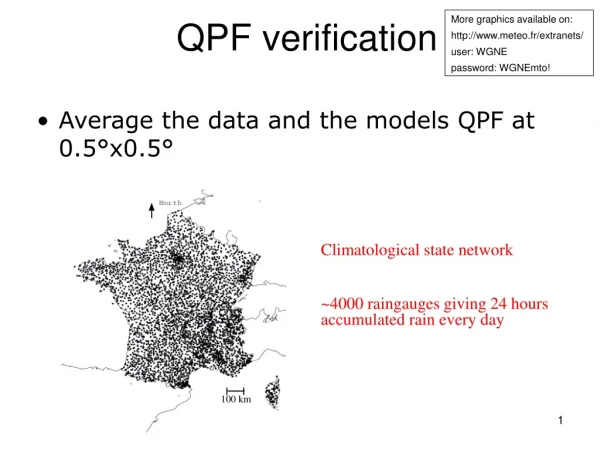
Development of an object-oriented verification technique for QPF Michael Baldwin1 Matthew Wandishin2, S. Lakshmivarahan3 1 Cooperative Institute for Mesoscale Meteorological Studies, University of Oklahoma 2 Institute for Atmospheric Physics, University of Arizona 3 School of Computer Science, University of Oklahoma
Traditional verification • Compare a collection of matching pairs of forecast and observed values at the same set of points in space/time • One “score” might end up representing the accuracy of millions of points, thousands of cases, hundreds of meteorological events • Boiling down that much information into a couple of numbers is not very meaningful
OBSERVED FCST #1: smooth Forecast #1: smooth OBSERVED FCST #2: detailed
“Measures-oriented” (Brooks and Doswell, 1996) approach to verifying these forecasts
Characterize the forecast and observed fields • Verify the forecast with a similar approach that a human forecaster would use to visualize the forecast/observed fields • Characterize features, phenomena, events, etc. found in forecast and observed fields by assigning attributes to each object
Object-oriented approach to verification • Decompose fields into sets of objects that can be objectively identified and described by attributes • Use image processing and data mining techniques to locate and classify events • Produce scores based upon the similarity/dissimilarity between forecast and observed objects • Analyze joint distribution of forecast and observed objects • Similar to Neilley (1993)
Possible scores produced by this approach d f f = (af, bf, cf, …, xf, yf ) o = (ao, bo, co, …, xo, yo) • score = function( f , o) • d ( f , o ) = ( f - o )t A ( f - o ) Generalized Euclidean distance, measure of dissimilarity A is a weight matrix, different attributes would probably have different weights • c ( f , o ) = cov ( f , o ) Covariance, measure of similarity o
Event #16 Characterization: How? • Locate an event Could use image processing edge detection routines
Characterization: How? • Assign attributes Examples: location, mean, variance, structure Event #16 x=37.3, y=87.8, b=2.8
attribute? Multiscale statistical properties (Harris et al 2001) • Fourier power spectrum • Generalized structure function: spatial correlation • Moment-scale analysis: intermittency of a field, sparseness of sharp intensities • Looking for “power law”, much like in atmospheric turbulence (–5/3 slope) FIG. 3. Isotropic spatial Fourier power spectral density (PSD) for forecast RLW (qr; dotted line) and radar-observed qr (solid line). Comparison of the spectra shows reasonable agreement at scales larger than 15 km. For scales smaller than 15 km, the forecast shows a rapid falloff in variability in comparison with the radar. The estimated spectral slope with fit uncertainty is = 3.0 ± 0.1
Fourier power spectra • Compare 3h accumulated QPF to radar/gage analyses • Forecasts were linearly interpolated to same 4km grid as “Stage IV” analysis • Errico (1985) Fourier analysis code used. 2-d Fourier transform converted to 1-d by annular average • Fixed grid used for analysis located away from complex terrain of Western U.S. • Want to focus on features generated by model physics and dynamics, free from influence of orographically forced circulations
Example Obs_4 Eta_12 Eta_8 log[E(k)] log[wavenumber] WRF_22 WRF_10 KF_22
Summary • Developing an “object-oriented” verification approach by characterizing forecasts and observations • Examining use of spatial structure and variability as potential attributes • Provides information on realism of forecasts that traditional QPF verification measures do not • Working with forecasters/users to determine useful attributes for characterizing events