Analysis of Hybridization Signals Reveals De Novo Deletions in Segregating Progeny
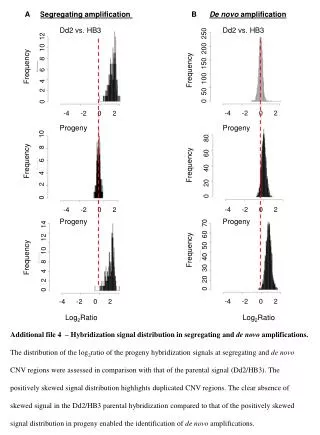
This study investigates the distribution of log2 ratios of hybridization signals from progeny with segregating and de novo deletions. By comparing progeny data against parental signals from Dd2 and HB3, we observe a negatively skewed distribution in progeny, indicating the presence of deleted CNV regions. The absence of similar skewness in parental hybridization signals emphasizes the feasibility of identifying de novo deletions, enhancing our understanding of genetic variations and their implications in progeny analysis.

Analysis of Hybridization Signals Reveals De Novo Deletions in Segregating Progeny
E N D
Presentation Transcript
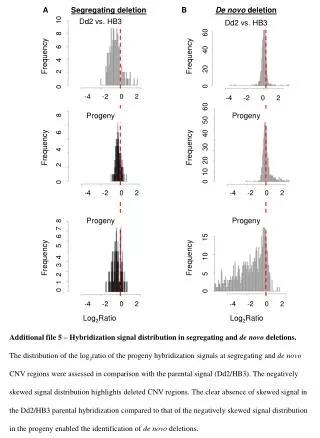
Segregating deletion B De novo deletion A Dd2 vs. HB3 Dd2 vs. HB3 0 2 4 6 8 10 Frequency Frequency 0 20 40 60 -4 -2 0 2 -4 -2 0 2 Progeny Progeny 0 10 20 30 40 50 60 0 2 4 6 8 Frequency Frequency -4 -2 0 2 -4 -2 0 2 Progeny Progeny 0 1 2 3 4 5 6 7 8 Frequency Frequency 0 5 10 15 -4 -2 0 2 -4 -2 0 2 Log2Ratio Log2Ratio Additional file 5 – Hybridization signal distribution in segregating and de novo deletions. • The distribution of the log2ratio of the progeny hybridization signals at segregating and de novo CNV regions were assessed in comparison with the parental signal (Dd2/HB3). The negatively skewed signal distribution highlights deleted CNV regions. The clear absence of skewed signal in the Dd2/HB3 parental hybridization compared to that of the negatively skewed signal distribution in the progeny enabled the identification of de novo deletions.