Download
1 / 43
430 likes | 439 Views
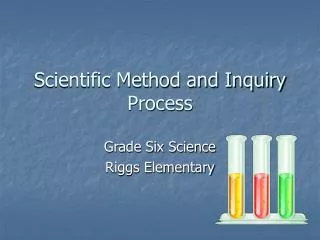
Science is a process Scientific inquiry is a search for information and explanation. Two Types of Scientific Inquiry. Two Types of Scientific Inquiry. Discovery Science - describes nature. Two Types of Scientific Inquiry. Discovery Science - describes nature

E N D
Science is a process Scientific inquiry is a search for information and explanation
Two Types of Scientific Inquiry • Discovery Science - describes nature
Two Types of Scientific Inquiry • Discovery Science - describes nature • Hypothesis-based Science – helps to explain natural phenomena
Two Types of Scientific Inquiry • Discovery Science - describes nature through observation • Hypothesis-based Science - explains the observations & how biological systems work Both arrive at conclusions using logic and reasoning
Types of Reasoning Inductive Reasoning flows from the specific to the general
Types of Reasoning Inductive Reasoning flows from the specific to the general Deductive Reasoning flows from the general to the specific
Discovery Science - Observations are made and recorded (data), may be qualitative or quantitative
Discovery Science - Observations are made and recorded (data), may be qualitative or quantitative Examples: Cell description databases of DNA sequences chimpanzee behavior - Uses inductive reasoning
Hypothesis-based Science • Seeks natural causes and explanation for observation
Hypothesis-based Science • Seeks natural causes and explanation for observation (How & Why) • Uses deductive reasoning
Applying hypothetico-deductive reasoning to a campground problem
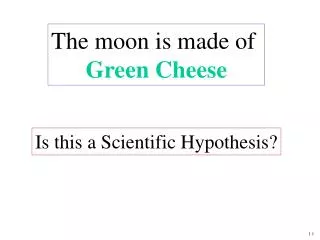
Hypothesis • A possible explanation for a well-defined question
Hypothesis • A possible explanation for a well-defined question • Proposed based on past experience and data made available through discovery science
Hypothesis • A possible explanation for a well-defined question • Proposed based on past experience and data made available through discovery science • Leads to a prediction which can be tested- measurable and controllable
Steps of hypothesis-driven scientific inquiry • Observation based on established knowledge
Steps of hypothesis-driven scientific inquiry • Observation based on established knowledge • Question
Steps of hypothesis-driven scientific inquiry • Observation based on established knowledge • Question • Hypothesis
Steps of hypothesis-driven scientific inquiry • Observation based on established knowledge • Question • Hypothesis • Prediction (if…….then) testable
Steps of hypothesis-driven scientific inquiry • Observation based on established knowledge • Question • Hypothesis • Prediction (if…….then) testable • Designing and conducting experiment (controlled)
Steps of hypothesis-driven scientific inquiry • Observation based on established knowledge • Question • Hypothesis • Prediction (if…….then) testable • Designing and conducting experiment (controlled) • Obtaining results (data)
Steps of hypothesis-driven scientific inquiry • Observation based on established knowledge • Question • Hypothesis • Prediction (if…….then) testable • Designing and conducting experiment (controlled) • Obtaining results (data) • Analysis & Conclusion (whether data supports or does not support the hypothesis)
Steps of hypothesis-driven scientific inquiry • Observation based on established knowledge • Question • Hypothesis • Prediction (if…….then) testable • Design and conducting experiment(controlled) • Obtaining results (data) • Analysis & Conclusion (whether data supports or does not support the prediction and the hypothesis) • Revision of hypothesis (if necessary)
Theory A general statement about a comprehensive concept supported by much evidence.
Theory A general statement about a comprehensive concept supported by much evidence. Broader than a hypothesis Brings together many conclusions
Theory A general statement about a comprehensive concept supported by much evidence. Broader than a hypothesis Brings together many conclusions Example: The Cell Theory
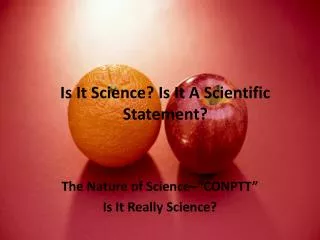
An explanation offered by a hypothesis must be for a question that is Well-defined Testable measurable controllable
Elements of Experimental Design • Identification of the: • Independent Variable - the factor that will be manipulated/altered by the scientist from experimental setup to setup • Dependent Variable - the factor that is counted, measured or observed • Uncontrolled Variables - alternative independent variables that have not been accounted/compensated for that may impact results • Controlled Variables - alternative independent variables we have accounted for (kept uniform among different groups) • Instituting a control - a setup where the independent variable is held constant or omitted so that the control treatment serves as a benchmark, yielding either an expected positive or negative value/result.
Presenting Results • Data is presented commonly in two standard formats: Figures and/or Tables • Figures include graphs, charts, diagrams, sketches, pictures/photos, etc. • When in graphical format, figures need appropriately labeled axes • Additionally, all figures need an appropriate label & title that have been correctly positioned below the graph • For example:
[Dependent Variable (y-axis)] Plant Height (centimeters) Concentration of CO2 (parts per million) [Independent Variable (x-axis)] Figure 1. Effect of CO2 Concentration on Growth of Strawberry Plant label Title (very descriptive)
Choosing an Appropriate Graphing Format • Line graph vs. Bar Graph vs. Scatter Plot • Line Graph - used in the presentation of continuous data; plot separate data points and then connect the points using lines • Bar Graph - used for data from separate distinct groups or non-numerical categories • Scatter Plot - use data to determine how much one variable is affected by the other; the closer the data points come when plotted to making a straight line, the higher the correlation between the two variables, or the stronger the relationship - correlations can be positive (showing a proportional relationship) or negative (inversely proportional relationship)
Tables are constructed with 2 columns and multiple rows - each column receives a heading with the left column representing the independent variable and the right column representing the dependent variable • Tables also need an appropriate label & title that have been correctly positioned above the table • For example:
Table 1. Growth of Strawberry Plant When Exposed to Differing Amounts of CO2 Gas.
Labeling of Figures and Tables is conducted independently of one another • For example, if there is a figure to start with followed by a table followed by two more figures followed by a final table, the labeling would occur as such: Figure 1. Table 1. Figure 2. Figure 3. Table 2.
Experimental Investigation: Lab 1 Observation: A person with high cardiovascular fitness has relatively lower resting pulse rate and a lower respiratory rate increase after exercise, and his or her pulse rate returns to normal faster than a less fit person
Question: Are females more cardiovascularly fit than males? • Hypothesis: Your simple tentative answer/statement to this question (does not require an explanation) • Prediction: In the format of “If…., then….” Ex: If the hypothesis is true, and the step test is carried out, then females should demonstrate/have…(whatever specific result you would anticipate in support of the hypothesis).
Designing an Experiment Cardiovascular fitness Determined by 1. increase in pulse rate (PR) after exercise. Measure PR before (resting rate) & after aerobic exercise (exercise rate) 2. Recovery time to resting pulse rate - how many minutes it takes to return to resting rate after exercise.