Download
1 / 15
150 likes | 262 Views
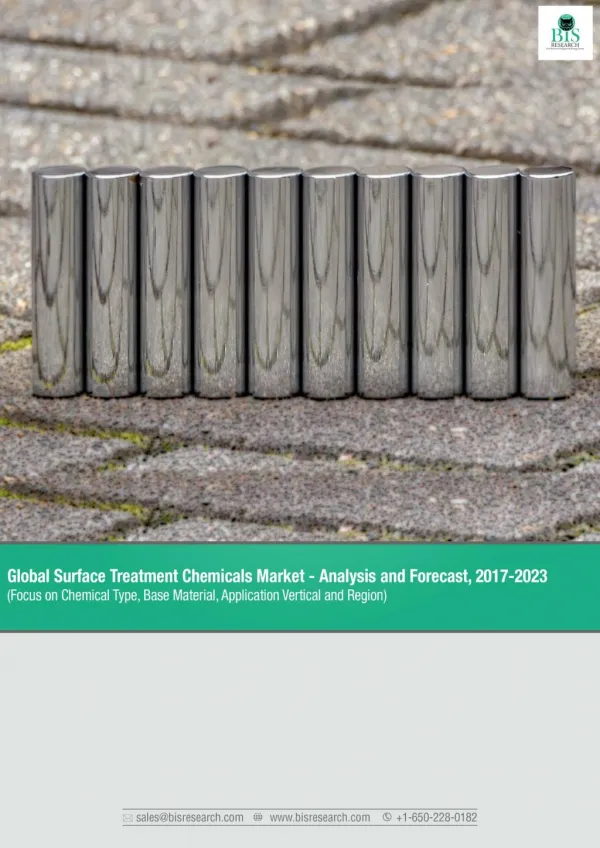
Surface treatment of metal plays an enormous role in extending the life of metals, such as in automotive bodies and construction materials, which makes the components durable to use for a longer period of time.

E N D
Global Surface Treatment Chemicals Market - Analysis and Forecast, 2017-2023 (Focus on Chemical Type, Base Material, Application Vertical and Region) The global surface treatment chemicals market is estimated to witness growth at a CAGR of 7.8% over the period of 2017 to 2023. This growth in the market is attributed to the increasing demand from various end use application verticals such as automotive industry, general industry, coil industry, industrial machinery, aerospace industry etc. Surface treatment is the process in which the adhered surface of any base material like metal, plastic etc. is cleaned and/or chemically treated to promote better adhesion and enhance properties like improved appearance, wettability, solderability, corrosion resistance, tarnish resistance, chemical resistance, wear resistance, hardness and surface friction. Surface treatment is done to prevent or delay corrosion, make the material more durable and tough to bear extreme wear and tear and increase the surface energy level of a particular metal surface so that it can easily adhere to the printing or coating taking place. Surface treatment of metal plays an enormous role in extending the life of metals, such as in automotive bodies and construction materials, which makes the components durable to use for a longer period of time. Europe acquired the largest market share in the surface treatment chemicals market. However, APAC is identified as the fastest growing region, followed by Middle East & Africa and North America. APAC is expected to be the leading market by the end of 2023 owing to the increasing industrialization and widespread involvement of companies in APAC countries into manufacturing surface treatment chemicals. Moreover, the increasing application areas and end use industries in this region is also a factor driving the growth of the market here. The report is a compilation of different segments of global surface treatment chemicals market including market breakdown by base material, chemical type, application and geographical location. It also includes sections on competitive insights and market dynamics. Herein the revenue generated from surface treatment chemicals is tracked to calculate the market size. While highlighting the key driving and restraining forces for this market, the report also provides a comprehensive section of the application areas of the surface treatment chemicals market. It also details the key participants involved in the industry. The report answers the following questions about the global surface treatment chemicals market: • What is the global market size by of surface treatment chemicals market? • What are the different base material types of surface treatment chemicals? What is their contribution in terms of revenue to the overall surface treatment chemicals revenue? • What are the different chemical types of surface treatment chemicals? What is their contribution in terms of revenue to the overall surface treatment chemicals revenue? • What are the different application areas of surface treatment chemicals? What is their contribution in terms of revenue to the overall surface treatment chemicals revenue? www.bisresearch.com
Global Surface Treatment Chemicals Market - Analysis and Forecast, 2017-2023 (Focus on Chemical Type, Base Material, Application Vertical and Region) • What are the different factors driving and challenging the global surface treatment chemicals market in the forecast period? • What are the different opportunities to look for investment in the global surface treatment chemicals market? • Who are the leading players in the global surface treatment chemicals market? What are the key strategies they have followed to expand their market in surface treatment chemicals business? • What kind of new strategies are being adopted by established and naive participants to make a mark in the industry? • Which region will lead the global surface treatment chemicals market by the end of forecast period? Also which country in that specific region will have the largest and smallest market share by value and volume in the forecast period? • Which application will lead the global surface treatment chemicals market by the end of forecast period? • Which end use industry will find the largest usage of surface treatment chemicals in the forecast period? • What is the future trend that will trail in this industry and which domains are right to focus on to make a smart move in investment? CAGR 7.8% xx Chemicals Market Size: Surface Treatment $Million xx xx 2016 2017 2023 www.bisresearch.com
Global Surface Treatment Chemicals Market - Analysis and Forecast, 2017-2023 (Focus on Chemical Type, Base Material, Application Vertical and Region) CURRENT MARKET INFORMATION INFLUENCING FACTORS COMPETITOR ANALYSIS REGIONAL ANALYSIS ANALYSIS MARKET SIZE SUPPLY CHAIN ANALYSIS MARKET SHARE PRICING ANALYSIS COMPANY DEVELOPMENTS COMPETITIVE LANDSCAPE R&D ANALYSIS AGREEMENTS, COLLABORATIONS, & PARTNERSHIPS: More than 25 deals in last three years NEW PRODUCT LAUNCHES: More than 70 new product launches in last three years MARKET RESTRAINTS MARKET DRIVERS MARKET OPPORTUNITIES MARKET CHALLENGES INDUSTRY TRENDS GEOGRAPHIC USAGE PATTERN PARAMETERS FOR MARKET ESTIMATION By Base Material Type By Chemical Type By Region By Application Corrosion Protection Chemicals Automotive Industry OEM Components General Industry Coil Industry Industrial Machinery Aerospace Others (Glass, Wood industry etc.) Europe Metal Iron & Steel Aluminium Others Plastic Others (Glass, Wood etc.) Asia-Pacific Cleaners North America Anodizing Chemicals Middle East & Africa Passivation Agents South America Others (Paint Strippers etc.) www.bisresearch.com
Global Surface Treatment Chemicals Market - Analysis and Forecast, 2017-2023 (Focus on Chemical Type, Base Material, Application Vertical and Region) TABLE OF CONTENTS Executive Summary 1 Research Scope and Methodology 1.1 Scope of the Report 1.2 Global Surface Treatment Chemicals Market Research Methodology 1.2.1 Assumptions and Limitations 1.2.2 Primary Research 1.2.3 Secondary Research 1.2.4 Data Triangulation 1.2.5 Data Analysing & Market Estimation 1.2.6 Stakeholders 1.2.7 Influencing Factors 2 Market Dynamics 2.1 Drivers 2.1.1 Growing Demand from Various End Use Industries 2.1.2 Increasing Industrialization in APAC Region 2.1.3 Market Switch to Eco-friendly and Stable Chemicals 2.2 Restraints 2.2.1 Stringent Environmental Regulations 2.2.2 Recent Economic Slowdown in China 2.3 Opportunities 2.3.1 Opportunities in Emerging Applications and End Use Industries 2.3.2 Opportunities in Emerging Economies 2.3.3 Rapid Growth of High Tech Products 3 Competitive Insights 3.1 Key Strategies and Development Adopted by Players 3.1.1 Business Expansions 3.1.2 New Product Launches and Product Developments 3.1.3 Partnerships, Agreements and Collaborations 3.1.4 Mergers and Acquisitions 3.1.5 Other Developments 4 Industry Analysis 4.1 Supply Chain/ Value Chain Analysis 4.2 Player Share Analysis 4.3 Opportunity Matrix Analysis 4.3.1 Opportunity Matrix Analysis by Region 4.3.2 Opportunity Matrix Analysis by Country 4.4 Country Share Analysis 4.5 Porter’s Five Forces Analysis 4.5.1 Bargaining Power of Buyers (Moderate- High) 4.5.2 Bargaining Power of Suppliers (Low- Moderate) 4.5.3 Threat of Substitutes (Low) 4.5.4 Threat of New Entrants (Moderate- High) 4.5.5 Intensity of Competitive Rivalry (Moderate-High) 4.6 R & D Analysis of Leading Players 4.7 Future Trends & Developments 4.7.1 Shift from Phosphate to Oxide 4.7.2 Shift Towards Using Eco-Friendly Chemicals 4.7.3 Nano ceramic-based Conversion Coating 5 Global Surface Treatment Chemicals Market, by Chemical Type 5.1 Corrosion Protection Chemicals 5.1.1 Conversion Coatings 5.1.2 Coil Coatings 5.1.3 Others 5.2 Cleaners 5.2.1 Alkaline Degreasers 5.3 Anodizing Chemicals 5.4 Passivation Agents 5.5 Others 5.5.1 Paint Strippers 5.5.2 Metal Working Fluids 5.5.3 Glass Cutting Fluids 5.5.4 Paint Detackification Chemicals / Detackifiers 5.5.5 Others 6 Global Surface Treatment Chemicals Market, by Base Material 6.1 Metals 6.1.1 Iron & Steel 6.1.2 Aluminium 6.1.3 Others 6.2 Plastic 6.3 Others 6.3.1 Glass 6.3.2 Wood 7 Global Surface Treatment Chemicals Market, by Application 7.1 Automotive Industry 7.1.1 Automotive OEMs 7.1.2 Automotive Components www.bisresearch.com
Global Surface Treatment Chemicals Market - Analysis and Forecast, 2017-2023 (Focus on Chemical Type, Base Material, Application Vertical and Region) TABLE OF CONTENTS 8.2.2.3 Germany: Surface Treatment Chemicals Market, by Application 8.2.3 France 8.2.3.1 France: Surface Treatment Chemicals Market, by Chemical Type 8.2.3.2 France: Surface Treatment Chemicals Market, by Base Material 8.2.3.3 France: Surface Treatment Chemicals Market, by Application 8.2.4 The U.K. 8.2.4.1 The U.K: Surface Treatment Chemicals Market, by Chemical Type 8.2.4.2 The U.K: Surface Treatment Chemicals Market, by Base Material 8.2.4.3 The U.K: Surface Treatment Chemicals Market, by Application 8.2.5 Italy 8.2.5.1 Italy: Surface Treatment Chemicals Market, by Chemical Type 8.2.5.2 Italy: Surface Treatment Chemicals Market, by Base Material 8.2.5.3 Italy: Surface Treatment Chemicals Market, by Application 8.2.6 Spain 8.2.6.1 Spain: Surface Treatment Chemicals Market, by Chemical Type 8.2.6.2 Spain: Surface Treatment Chemicals Market, by Base Material 8.2.6.3 Spain: Surface Treatment Chemicals Market, by Application 8.2.7 Rest of Europe 8.2.7.1 Rest of Europe: Surface Treatment Chemicals Market, by Chemical Type 8.2.7.2 Rest of Europe: Surface Treatment Chemicals Market, by Base Material 8.2.7.3 Rest of Europe: Surface Treatment Chemicals Market, by Application 8.3 Asia-Pacific 8.3.1 Asia-Pacific : Surface Treatment Chemicals Market, by Country 7.2 General Industry 7.3 Coil Industry 7.4 Industrial Machinery/Heavy Equipment 7.5 Aerospace Industry 7.6 Others 7.6.1 Metal Working Industry 7.6.2 Glass Industry 7.6.3 Wood Industry 8 Global Surface Treatment Chemicals Market, by Geography 8.1 North America 8.1.1 North America: Surface Treatment Chemicals Market, by Country 8.1.2 The U.S. 8.1.2.1 The U.S.: Surface Treatment Chemicals Market, by Chemical Type 8.1.2.2 The U.S.: Surface Treatment Chemicals Market, by Base Material 8.1.2.3 The U.S.: Surface Treatment Chemicals Market, by Application 8.1.3 Canada 8.1.3.1 Canada.: Surface Treatment Chemicals Market, by Chemical Type 8.1.3.2 Canada: Surface Treatment Chemicals Market, by Base Material 8.1.3.3 Canada: Surface Treatment Chemicals Market, by Application 8.1.4 Mexico 8.1.4.1 Mexico: Surface Treatment Chemicals Market, by Chemical Type 8.1.4.2 Mexico: Surface Treatment Chemicals Market, by Base Material 8.1.4.3 Mexico: Surface Treatment Chemicals Market, by Application 8.2 Europe 8.2.1 Europe: Surface Treatment Chemicals Market by Country 8.2.2 Germany 8.2.2.1 Germany: Surface Treatment Chemicals Market, by Chemical Type 8.2.2.2 Germany: Surface Treatment Chemicals Market, by Base Material www.bisresearch.com
Global Surface Treatment Chemicals Market - Analysis and Forecast, 2017-2023 (Focus on Chemical Type, Base Material, Application Vertical and Region) TABLE OF CONTENTS Type 8.3.2 China 8.3.2.1 China: Surface Treatment Chemicals Market, by Chemical Type 8.3.2.2 China: Surface Treatment Chemicals Market, by Base Material 8.3.2.3 China: Surface Treatment Chemicals Market, by Application 8.3.3 India 8.3.3.1 India: Surface Treatment Chemicals Market, by Chemical Type 8.3.3.2 India: Surface Treatment Chemicals Market, by Base Material 8.3.3.3 India: Surface Treatment Chemicals Market, by Application 8.3.4 Japan 8.3.4.1 Japan: Surface Treatment Chemicals Market, by Chemical Type 8.3.4.2 Japan: Surface Treatment Chemicals Market, by Base Material 8.3.4.3 Japan: Surface Treatment Chemicals Market, by Application 8.3.5 South Korea 8.3.5.1 South Korea: Surface Treatment Chemicals Market, by Chemical Type 8.3.5.2 South Korea: Surface Treatment Chemicals Market, by Base Material 8.3.5.3 South Korea: Surface Treatment Chemicals Market, by Application 8.3.6 Rest of Asia-Pacific 8.3.6.1 Rest of APAC: Surface Treatment Chemicals Market, by Chemical Type 8.3.6.2 Rest of APAC: Surface Treatment Chemicals Market, by Base Material 8.3.6.3 Rest of APAC: Surface Treatment Chemicals Market, by Application 8.4 Rest of the World (RoW) 8.4.1 RoW: Surface Treatment Chemicals Market, by Region 8.4.2 Middle East & Africa (ME&A) 8.4.2.1 ME & A: Surface Treatment Chemicals Market, by Chemical 8.4.2.2 ME & A: Surface Treatment Chemicals Market, by Base Material 8.4.2.3 ME & A: Surface Treatment Chemicals Market, by Application 8.4.3 South America 8.4.3.1 South America: Surface Treatment Chemicals Market, by Chemical Type 8.4.3.2 South America: Surface Treatment Chemicals Market, by Base Material 8.4.3.3 South America: Surface Treatment Chemicals Market, by Application 9 Company Profiles 9.1 Henkel AG & Co. KGaA 9.1.1 Company Overview 9.1.2 Financials 9.1.2.1 Overall Financials 9.1.2.2 Geographic Revenue Mix 9.1.2.3 Business Segment Revenue Mix 9.1.2.4 Financial Summary 9.1.3 SWOT Analysis 9.2 Nihon Parkerizing Co., Ltd. 9.2.1 Company Overview 9.2.2 Financials 9.2.2.1 Overall Financials 9.2.2.2 Business Segment Revenue Mix 9.2.2.3 Financial Summary 9.2.3 SWOT Analysis 9.3 BASF 9.3.1 Company Overview 9.3.2 Financials 9.3.2.1 Overall Financials 9.3.2.2 Geographic Revenue Mix 9.3.2.3 Business Segment Revenue Mix 9.3.2.4 Chemetall 9.3.2.4.1 Chemetall-Overall Financials 9.3.2.4.2 Chemetall-Geographical Revenue Segmentation (2015) 9.3.2.5 Financial Summary 9.3.3 SWOT Analysis 9.4 Nippon Paint Holdings Co., Ltd 9.4.1 Company Overview www.bisresearch.com
Global Surface Treatment Chemicals Market - Analysis and Forecast, 2017-2023 (Focus on Chemical Type, Base Material, Application Vertical and Region) TABLE OF CONTENTS 9.11 McGean Specialty Chemicals 9.11.1 Company Overview 9.11.2 About the Company 9.12 Yuken Industry Co., Ltd 9.12.1 Company Overview 9.12.2 About the Company 9.13 Politeknik Metal A.Ş. 9.13.1 Company Overview 9.13.2 About the Company 9.14 Platform Specialty Products Corporation 9.14.1 Company Overview 9.14.2 Financials 9.14.2.1 Overall Financials 9.14.2.2 Geographic Revenue Mix 9.14.2.3 Business Segment Revenue Mix 9.14.2.4 Financial Summary 9.14.3 SWOT Analysis 9.15 Quaker Chemical Corporation 9.15.1 Company Overview 9.15.2 Financials 9.15.2.1 Overall Financials 9.15.2.2 Geographic Revenue Mix 9.15.2.3 Business Segment Revenue Mix 9.15.2.4 Financial Summary 9.15.3 SWOT Analysis 9.16 SUGEST 9.16.1 Company Overview 9.16.2 About the Company 9.17 AHC OberflächentechnikGmbH 9.17.1 Company Overview 9.17.2 About the Company 9.18 TIB Chemicals AG 9.18.1 Company Overview 9.18.2 About the Company 9.19 Bulk Chemicals Inc. 9.19.1 Company Overview 9.19.2 About the Company 9.20 SurTec International GmbH 9.20.1 Company Overview 9.20.2 About the Company 9.5 JCU Corporation 9.5.1 Company Overview 9.5.2 Financials 9.5.2.1 Overall Financials 9.5.2.2 Business Segment Revenue Mix 9.5.2.3 Financial Summary 9.5.3 SWOT Analysis 9.6 PPG Industries, Inc. 9.6.1 Company Overview 9.6.2 Financials 9.6.2.1 Financial Summary 9.6.3 SWOT Analysis 9.7 Oerlikon 9.7.1 Company Overview 9.7.2 Financials 9.7.2.1 Overall Financials 9.7.2.2 Geographic Revenue Mix 9.7.2.3 Business Segment Revenue Mix 9.7.2.4 Financial Summary 9.7.2.5 SWOT Analysis 9.8 Axalta Coating Systems Ltd. 9.8.1 Company Overview 9.8.2 Financials 9.8.2.1 Overall Financials 9.8.2.2 Business Segment Revenue Mix 9.8.2.3 Geographical Revenue Mix 9.8.2.4 Financial Summary 9.8.3 SWOT Analysis 9.9 Derivados Del Fluor 9.9.1 Company Overview 9.9.2 About the Company 9.10 Solvay S.A 9.10.1 Company Overview 9.10.2 Financials 9.10.2.1 Overall Financials 9.10.2.2 Business Segment Revenue Mix 9.10.2.3 Geographic Revenue Mix 9.10.2.4 Financial Summary 9.10.3 SWOT Analysis 9.4.2 Financials 9.4.2.1 Overall Financials 9.4.2.2 Geographic Revenue Mix 9.4.2.3 Business Segment Revenue Mix 9.4.2.4 Financial Summary 9.4.3 SWOT Analysis www.bisresearch.com
Global Surface Treatment Chemicals Market - Analysis and Forecast, 2017-2023 (Focus on Chemical Type, Base Material, Application Vertical and Region) LIST OF TABLE Table 8.1 Global Surface Treatment Chemicals Market Size by Region, US$ Million (2016–2023) Table 8.2 North America’s Surface Treatment Chemicals Market by Country, $Million (2016–2023) Table 8.3 The U.S.: Surface Treatment Chemicals Market, by Chemical Type, $Million (2016–2023) Table 8.4 The U.S.:Surface Treatment Chemicals Market, by Base Material Type, $Million (2016–2023) Table 8.5 The U.S.:Surface Treatment Chemicals Market, by Application, $Million (2016–2023) Table 8.6 Canada: Surface Treatment Chemicals Market, by Chemical Type, $Million (2016–2023) Table 8.7 Canada: Surface Treatment Chemicals Market, by Base Material Type, $Million (2016–2023) Table 8.8 Canada: Surface Treatment Chemicals Market, by Application, $Million (2016–2023) Table 8.9 Mexico: Surface Treatment Chemicals, by Chemical Type, $Million (2016– 2023) Table 8.10 Mexico: Surface Treatment Chemicals Market, by Base Material Type, $Million (2016–2023) Table 8.11 Mexico: Surface Treatment Chemicals Market, by Application, $Million (2016–2023) Table 8.12 Europe: Surface Treatment Chemicals Market by Country, $Million (2016–2023) Table 8.13 Germany: Surface Treatment Chemicals Market, by Chemical Type, $Million (2016–2023) Table 8.14 Germany: Surface Treatment Chemicals Market, by Base Material Type, $Million (2016–2023) Table 3.1 Business Expansions Table 3.2 New Product Launches and Product Developments Table 3.3 Partnerships, Agreements and Collaborations Table 3.4 Mergers and Acquisitions Table 3.5 Other Developments Table 4.1 R & D Analysis of Leading Players in Surface Treatment Chemicals Market Table 5.1 Highlights of Various Chemical Types Table 5.2 Global Surface Treatment Chemicals Market Size, by Chemical Type (2016– 2023) Table 5.3 Corrosion Protection Chemicals Market Size by Region (2016–2023) Table 5.4 Types of Electrical Insulation Coating and Application Areas Table 5.5 Cleaners Chemicals Market Size by Region (2016–2023) Table 5.6 Anodizing Chemicals Market Size by Region (2016–2023) Table 5.7 Passivation Agents’ Market Size by Region (2016–2023) Table 5.8 Other Chemicals Market Size by Region (2016–2023) Table 6.1 Surface Treatment Chemicals Market Size by Base Material (2016–2023) Table 6.2 Surface Treatment Chemicals Market Size by Metal (2016–2023) Table 7.1 Global Surface Treatment Chemicals Market Size by Application, $ Million (2016–2023) Table 7.2 Automotive Surface Treatment Chemicals Table 7.2 Global Surface Treatment Chemicals Market by Automotive Segments, $Million (2016–2023) Table 7.3 Overview of Different Case Hardening Techniques Table 7.4 Various Methods for Surface Treatment of Wood www.bisresearch.com
Global Surface Treatment Chemicals Market - Analysis and Forecast, 2017-2023 (Focus on Chemical Type, Base Material, Application Vertical and Region) LIST OF FIGURES Table 8.29 Rest of Europe: Surface Treatment Chemicals, by Base Material Type, $Million (2016–2023) Table 8.30 Rest of Europe: Surface Treatment Chemicals Market, by Application, $Million (2016–2023) Table 8.31 Asia-Pacific: Surface Treatment Chemicals Market by Country, $Million (2016–2023) Table 8.32 China: Surface Treatment Chemicals Market, by Chemical Type, $Million (2016–2023) Table 8.33 China: Surface Treatment Chemicals Market, by Base Material Type, $Million (2016–2023) Table 8.34 China: Surface Treatment Chemicals Market, by Application, $Million (2016–2023) Table 8.35 India: Surface Treatment Chemicals Market, by Chemical Type, $Million (2016–2023) Table 8.36 India: Surface Treatment Chemicals Market, by Base Material Type, $Million (2016–2023) Table 8.37 India: Surface Treatment Chemicals Market, by Application, $Million (2016–2023) Table 8.38 Japan: Surface Treatment Chemicals Market, by Chemical Type, $Million (2016–2023) Table 8.39 Japan: Surface Treatment Chemicals Market, by Base Material Type, $Million (2016–2023) Table 8.40 Japan: Surface Treatment Chemicals Market, by Application, $Million (2016–2023) Table 8.41 South Korea: Surface Treatment Chemicals Market, by Chemical Type, $Million (2016–2023) Table 8.42 South Korea: Surface Treatment Chemicals Market, by Base Material Type, $Million (2016–2023) Table 8.15 Germany: Surface Treatment Chemicals Market, by Application, $Million (2016–2023) Table 8.16 France: Surface Treatment Chemicals Market, by Chemical Type, $Million (2016–2023) Table 8.17 France: Surface Treatment Chemicals Market, by Base Material Type, $Million (2016–2023) Table 8.18 France: Surface Treatment Chemicals Market, by Application, $Million (2016–2023) Table 8.19 The U.K.: Surface Treatment Chemicals Market, by Chemical Type, $Million (2016–2023) Table 8.20 The U.K.: Surface Treatment Chemicals Market, by Base Material Type, $Million (2016–2023) Table 8.21 The U.K.: Surface Treatment Chemicals Market, by Application, $Million (2016–2023) Table 8.22 Italy: Surface Treatment Chemicals Market, by Chemical Type, $Million (2016–2023) Table 8.23 Italy: Surface Treatment Chemicals Market, by Base Material Type, $Million (2016–2023) Table 8.24 Italy: Surface Treatment Chemicals Market, by Application, $Million (2016–2023) Table 8.25 Spain: Surface Treatment Chemicals Market, by Chemical Type, $Million (2016–2023) Table 8.26 Spain: Surface Treatment Chemicals Market, by Base Material Type, $Million (2016–2023) Table 8.27 Spain: Surface Treatment Chemicals Market, by Application, $Million (2016–2023) Table 8.28 Rest of Europe: Surface Treatment Chemicals Market, by Chemical Type, $Million (2016–2023) www.bisresearch.com
Global Surface Treatment Chemicals Market - Analysis and Forecast, 2017-2023 (Focus on Chemical Type, Base Material, Application Vertical and Region) LIST OF FIGURES Table 8.43 South Korea: Surface Treatment Chemicals Market, by Application, $Million (2016–2023) Table 8.44 Rest of Asia-Pacific: Surface Treatment Chemicals Market, by Chemical Type, $Million (2016–2023) Table 8.45 Rest of Asia-Pacific: Surface Treatment Chemicals Market, by Base Material Type, $Million (2016– 2023) Table 8.46 Rest of Asia-Pacific: Surface Treatment Chemicals Market, by Application, $Million (2016–2023) Table 8.47 Middle East & Africa: Surface Treatment Chemicals Market, by Chemical Type, $Million (2016–2023) Table 8.48 Middle East & Africa: Surface Treatment Chemicals Market, by Base Material Type, $Million (2016– 2023) Table 8.49 Middle East & Africa: Surface Treatment Chemicals Market, by Application, $Million (2016–2023) Table 8.50 South America: Surface Treatment Chemicals Market, by Chemical Type, $Million (2016–2023) Table 8.51 South America: Surface Treatment Chemicals Market, by Base Material Type, $Million (2016–2023) Table 8.52 South America: Surface Treatment Chemicals Market, by Application, $Million (2016–2023) www.bisresearch.com
Global Surface Treatment Chemicals Market - Analysis and Forecast, 2017-2023 (Focus on Chemical Type, Base Material, Application Vertical and Region) LIST OF FIGURES Figure 4.4 Surface Treatment Chemicals Market Opportunity Matrix Analysis, by Region: 2016 Figure 4.5 Surface Treatment Chemicals Market Opportunity Matrix Analysis, by Country: 2016 Figure 4.6 Surface Treatment Chemicals Market Opportunity Matrix Analysis, by Country: 2023 Figure 4.7 Surface Treatment Chemicals Market Country Share Analysis: 2016 Figure 4.8 Global Surface Treatment Chemicals Market: Porter’s Five Forces Analysis Figure 5.1 Global Surface Treatment Chemicals Market Size, by Chemical Type (2016–2023) Figure 5.2 Corrosion Protection Chemicals Market by Region (2017 &2023) Figure 5.3 Cleaners’ Market by Region (2017 &2023) Figure 5.4 Anodizing Chemicals Market by Region (2017 & 2023) Figure 5.5 Passivation Agents’ Market by Region (2017 &2023) Figure 5.6 Others Chemicals Market by Region (2017 &2023) Figure 6.1 Global Surface Treatment Chemicals Market, by Base Material: 2016 Figure 6.2 Global Surface Treatment Chemicals Market, by Base Material: 2023 Figure 6.3 Market Overview of Different Metals in Surface Treatment Chemicals Market Figure 6.4 Iron & Steel Surface Treatment Chemicals Market, 2016-2023 Figure 6.5 Aluminium Surface Treatment Chemicals Market (2016-2023) Figure 6.6 Other Metals Surface Treatment Chemicals Market, 2016-2023 Figure 6.7 Surface Treatment Chemicals Market Size for Plastic (2016–2023) Figure 6.8 Surface Treatment Chemicals Market Size for Other Base Materials (2016– 2023) Figure 7.1 Global Surface Treatment Chemicals Market Segmentation by Application Figure 7.2 Global Surface Treatment Chemicals Figure 1 Surface Treatment Chemicals Market Attractiveness, By Chemical Type, Base Material, Application and Region Figure 2 Global Surface Treatment Chemicals Market Size Overview Figure 3 Surface Treatment Chemicals Market Size, by Chemical Type: 2016 & 2023 Figure 4 Surface Treatment Chemicals Market Share by Base Material: 2016 & 2023 Figure 5 Surface Treatment Chemicals Market Size, by Different Base Materials: 2016 Figure 6 Surface Treatment Chemicals Market, by Application: 2017-2023 Figure 7 Automotive Surface Treatment Chemicals Market, by Automotive Parts: 2016-2023 Figure 8 Surface Treatment Chemicals Market, by Region Figure 1.1 Global Surface Treatment Chemicals Market Scope Figure 1.2 Report Design Figure 1.3 Primary Interviews’ Breakdown, by Companies, Designation, and Region Figure 1.4 Sources of Secondary Research Figure 1.5 Data Triangulation Figure 1.6 Top-Down & Bottom-Up Approach Figure 1.7 Surface Treatment Chemicals Market Stakeholders Figure 1.8 Surface Treatment Chemicals Market Influencing Factors Figure 2.1 Global Surface Treatment Market Dynamics Figure 3.1 Overview of Organic & Inorganic Strategies adopted by Key Players Figure 3.2 Total Number of Strategies and Developments Figure 3.3 Percentage Share of Strategies and Developments Adopted by Key Players Figure 4.1 Global Surface Treatment Supply Chain Figure 4.2 Surface Treatment Chemicals Market Player Share Analysis: 2016 Figure 4.3 Surface Treatment Chemicals Market Player Share Analysis: 2017 (Estimated) www.bisresearch.com
Global Surface Treatment Chemicals Market - Analysis and Forecast, 2017-2023 (Focus on Chemical Type, Base Material, Application Vertical and Region) LIST OF FIGURES Forecast by Region, 2017 & 2023 Figure 8.11 Rest of the World: Surface Treatment Chemical Market Overview by Region, $Million, 2016- 2023 Figure 8.12 Middle East & Africa: Surface Treatment Chemicals Market Size, $Million, 2016 and 2023 Figure 8.13 South America: Surface Treatment Chemicals Market Size, $Million, 2016-2023 Figure 9.1 Overall Financials, 2014-16 ($Million) Figure 9.2 Geographic Revenue Mix, 2014-16 ($Million) Figure 9.3 Segment Revenue Mix, 2014-16 ($Million) Figure 9.4 Overall Financials, 2013-15 ($Million) Figure 9.5 Segment Revenue Mix, 2013-15 ($Million) Figure 9.6 Overall Financials, 2014-16 Figure 9.7 Geographic Revenue Mix, 2014-16 ($Million) Figure 9.8 Segment Revenue Mix, 2014-16 ($Million) Figure 9.9 Chemetall-Overall Financials Figure 9.10 Chemetall-Geographical Revenue Segmentation (2015) Figure 9.11 Overall Financials, 2014-16 ($Million) Figure 9.12 Geographic Revenue Mix, 2014-16 ($Million) Figure 9.13 Segment Revenue Mix, 2014-16 ($Million) Figure 9.14 Overall Financials, 2013-15 Figure 9.15 Segment Revenue Mix, 2013-15 ($Million) Figure 9.16 Overall Financials, 2014-2016 Figure 9.17 Geographic Revenue Mix, 2014- 2016 Figure 9.18 Segment Revenue Mix, 2014-2016 Figure 9.19 Overall Financials, 2014-16 Figure 9.20 Geographic Revenue Mix, 2014-16 ($Million) Figure 9.21 Segment Revenue Mix, 2014-15 ($Million) Market Size by Application, (2016– 2023) Figure 7.3 Automotive Surface Treatment Chemicals Market Size, $Million (2016–2023) Figure 7.4 General Industry Surface Treatment Chemicals Market, $Million (2016– 2023) Figure 7.5 Coil Industry Surface Treatment Chemicals Market, $Million (2016– 2023) Figure 7.6 Industrial Machinery Surface Treatment Chemicals Market, $Million (2016–2023) Figure 7.7 Aerospace Industry Surface Treatment Chemicals Market, $Million (2016–2023) Figure 7.8 Other Industries’ Surface Treatment Chemicals Market, $Million (2016– 2023) Figure 8.1 Global Surface Treatment Chemicals Market Geographical Segmentation Figure 8.2 Global Surface Treatment Chemical Market Growth Rate by Geography Figure 8.3 Global Surface Treatment Chemicals Market Size by Region, $Million (2016–2023) Figure 8.4 North America: Surface Treatment Chemical Market Forecast by Country, 2017 & 2023 Figure 8.5 North America: Surface Treatment Chemicals Market Overview by Country, 2016 - 2023, $Million Figure 8.6 Europe: Surface Treatment Chemical Market Forecast by Country, 2017 & 2023 Figure 8.7 Europe: Surface Treatment Chemicals Market, by Country, $Million, 2016-2023 Figure 8.8 Asia-Pacific: Surface Treatment Chemical Market Forecast by Country, 2017 & 2023 Figure 8.9 Asia-Pacific: Surface Treatment Chemicals Market Overview by Country, $Million, 2016–2023 Figure 8.10 Rest of the World: Surface Treatment Chemical Market www.bisresearch.com
Global Surface Treatment Chemicals Market - Analysis and Forecast, 2017-2023 (Focus on Chemical Type, Base Material, Application Vertical and Region) LIST OF FIGURES Figure 9.22 Overall Financials, 2014-16 Figure 9.23 Segment Revenue Mix, 2014-16 ($Million) Figure 9.24 Geographical Revenue Mix, 2014-16 ($Million) Figure 9.25 Overall Financials, 2014-16 Figure 9.26 Segment Revenue Mix, 2014-16 ($Million) Figure 9.27 Geographic Revenue Mix, 2013-15 ($Million) Figure 9.28 Overall Financials, 2014-16 ($Million) Figure 9.29 Geographic Revenue Mix, (April 2013-Dec 2013) Figure 9.30 Geographic Revenue Mix by Country (2014-15) ($Million) Figure 9.31 Segment Revenue Mix, 2014-16 ($Million) Figure 9.32 Overall Financials, 2014-16 ($Million) Figure 9.33 Geographic Revenue Mix, 2014-16 ($Million) Figure 9.34 Segment Revenue Mix, 2013-15 ($Million) www.bisresearch.com
Global Surface Treatment Chemicals Market - Analysis and Forecast, 2017-2023 (Focus on Chemical Type, Base Material, Application Vertical and Region) DISCLAIMER BIS Research provides valuable market intelligence to an exclusive group of customers in response to orders. The report is licensed for the customer’s internal use only and is subject to restrictions set henceforth. This document and its contents are confidential and may not be further distributed, published or reproduced, in whole or in part, by any medium or in any form for any purpose, without the express written consent of BIS Research. Customer will not disclose the contents of the report, whether directly in any media or indirectly through incorporation in a database, marketing list, report or otherwise, or use or permit the use of Information to generate any statistical or other information that is or will be provided to third parties; or voluntarily produce Information in legal proceedings. Market reports are based on expectations, estimates and projections as of the date such information is available. Any recommendation contained in this report may not be suitable for all investors or businesses. The market conclusions drawn are necessarily based upon a number of estimates and assumptions that, while considered reasonable by BIS Research as of the date of such statements, are inherently subject to market fluctuations and business, economic and competitive uncertainties and contingencies. For more details regarding permission, please contact us: Email: sales@bisresearch.com Tel: +1 650 228 0182 www.bisresearch.com