Download
1 / 14
180 likes | 303 Views
Nano satellites being deployed for emerging satellite application like disaster management and nations developing their own global navigation satellite system (GNSS), are expected to create lucrative opportunities for the market is the next five years.

E N D
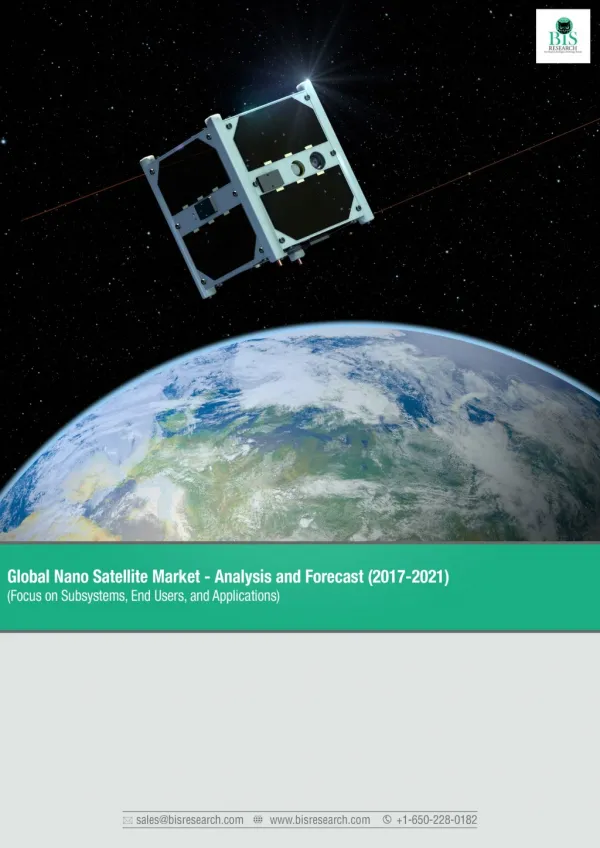
Global Nano Satellite Market - Analysis and Forecast 2017-2021 Space industry is filled with a range of activities, which are utilizing resources to create value and benefit society, globally, in terms of understanding, exploring, researching, managing, and utilizing space. Space is a government dominated sector, with distinguishing features such as the use of cutting edge technologies and prolonged project development time. Currently, utilization of space for defense applications is prominent, owing to space technologies that have both military and civil applications like weather forecast, surveillance, earth observation, navigation, and many more. However, growth of commercial space sector is on hike, owing to increasing number of satellite startups developing disruptive technologies in space industry such as small satellites (micro, nano, pico, and femto). Major government space organizations worldwide are continuously increasing their funding in space industry to develop efficient and cost effective satellite solutions. The U.S. government’s budget for space industry accounted for 13.80% of the overall market, and is expected to increase in the coming future, owing to investments in technological development related to major space projects. Currently, the space industry is at the cusp of a major revolution as more than 3,600 small satellites including nano, micro, and pico, are expected to be launched over the course of next ten years. Nano satellite, in particular, is emerging as a promising market in the small satellite industry. The nano satellite market witnessed a high growth owing to advancements in satellite miniaturization, increasing capability of electronic technology, and ascending demand for small satellite constellations. Recent innovations in satellite equipment and services is expected to enable nano satellite technology to reach a wider segment of consumers in the industry. Nano satellite constitute different subsystems mainly structure, telecommunication, on-board computer, power system, attitude control system, payload, and propulsion system, which are collectively known as satellite bus. Payload differs according to the application of the satellite which are communication, intelligence, surveillance & reconnaissance (ISR), earth observation and remote sensing, academic, research and space exploration, navigation, and technology demonstration. The end users for the market are academic; the commercial includes agriculture, IT & telecommunication, oil & gas, and mining; government; defense; and non- profit organizations. Some of the key players in the nano satellite market include Interorbital Systems, Israel Aerospace Industries Ltd., Lockheed Martin Corporation, NanoAvionika, LLC, Northrop Grumman Corporation, OHB SE, Orbital ATK, Inc., and Planet Labs, Inc. www.bisresearch.com
Global Nano Satellite Market - Analysis and Forecast 2017-2021 Global Nano Satellite Market Size, 2016-2021 XX Value ($Million) XX XX XX XX XX 2016 2017 2018 2019 2020 2021 Source: BIS Research Analysis The global market for nano satellite was estimated to be $127.2 million in the year 2016. Nano satellite market is filled with developments for emerging technologies such as 3-D printed electronic components, on-board internet system, and electronic propulsion system, among others, which are expected to increase competition in the near future as well as facilitate utilization of nano satellite as primary satellite for the space mission. The nano satellite market is expected to grow at a double digit CAGR during the forecast period, 2017-2021. At present, government end user holds major share of the global nano satellite market owing to high investment by government space agencies in developing efficient and cost effective satellite subsystems for nano satellite, in order to meet its demand in varied applications such as earth observation, communication, navigation, remote sensing, academic research, and space exploration. Additionally, industries including IT & telecommunication, agriculture, mining, and oil & gas, among others as well as commercial end users are expected to find huge opportunities in the nano satellite market. Different applications of nano satellite includes communication, intelligence, surveillance, & reconnaissance (ISR), earth observation & remote sensing, academic research & space exploration, navigation, and technology demonstration. Currently, academic research & space exploration application of nano satellite have the highest penetration in the market owing to the demand for cost efficient satellite solution to increase access of space to developing nations, colleges, and universities. However, navigation application of nano satellite is expected to garner highest growth in the market mainly driven by continued developments by different nations for new features in GNSS to improve their performance. www.bisresearch.com
Global Nano Satellite Market - Analysis and Forecast 2017-2021 Following points provide a concrete description of the report content and the topics covered in the report: • What are different types of subsystems incorporated in a nano satellite and details about respective manufacturers? • What is the revenue generation of nano satellites being utilized by different end users? • What is the revenue generation of nano satellite as per different applications? • What is the market value of different applications of nano satellite on the basis of varied end users (academic, government, commercial, defense, and non-profit organisation)? • What is the market size of nano satellite on the basis of different geographical regions? Furthermore, what is the market size of different end users as per the nano satellite launches in these regions? • What are the different factors driving the market towards growth as well as critical challenges and opportunities for stakeholders present in the nano satellite industry? • What kind of new strategies are being adopted by existing market players to make a mark in the industry? • What is the competitive strength of key players in the nano satellite market by analysing through a competitive benchmarking model? • How attractive is the market for different stakeholders present in the market by using Porter’s Five Forces model? • Additionally, key market players are analysed and profiled in detail in the report. This section covers the business financials, company snapshots, key products & services, major developments, SWOT analysis and future programs (if any) www.bisresearch.com
Global Nano Satellite Market - Analysis and Forecast 2017-2021 Analysis & Forecast: Base Year: 2016 Estimated Year: 2017 5 Year Annual Estimated Forecast (2017-2021) Market by Subsystem: Payload, Structure, Telecommunication, On-Board Computer, Power System, Attitude Control System, and Propulsion System Market by End User: Academic, Commercial, Government, Defense, and Non-Profit Organisation Market by Application: Communication, Intelligence, Surveillance, & Reconnaissance (ISR), Earth Observation & Remote Sensing, Academic Research & Space Exploration, Navigation, and Technology Demonstration Market by Geography: North America (the U.S. and Canada), Europe (the UK, Germany, France, Russia, Spain, and Rest of Europe), Asia-Pacific (China, India, Japan, South Korea, and Rest of Asia- Pacific), Rest of the World (Latin America, Middle East and Africa) www.bisresearch.com
Global Nano Satellite Market - Analysis and Forecast 2017-2021 TABLE OF CONTENTS Executive Summary 1 Research Scope & BIS Methodology 1.1 Scope of the Report 1.2 Nano Satellite Market Research Methodology 1.3 Assumptions and Limitations 2 Market Dynamics 2.1 Drivers 2.1.1 Advancements in Satellite Miniaturization 2.1.2 Increasing Capability of Electronic Technology 2.1.3 Ascending Demand for Small Satellite Constellations 2.2 Challenges 2.2.1 Developing Safe, Low-Cost, and Small Payload Nano Satellite to Launch Beyond Low-Earth Orbit 2.2.2 Clean-Up and Removal of Space Debris 2.3 Opportunities 2.3.1 Disaster Management - An Emerging Nano Satellite Application 2.3.2 Nations Developing Their Own Global Navigation Satellite System (GNSS) 2.4 Top Impacting Factors 3 Competitive Insights 3.1 Competitive Landscape 3.2 Key Market Developments and Strategies in the Global Nano Satellite Market 3.2.1 Share of Key Market Developments and Strategies 3.2.2 Product Launches 3.2.3 Collaborations 3.2.4 Contracts 3.2.5 Others 3.3 Competitive Benchmarking 3.4 Technological Scenario and Patent Analysis 3.4.1 Technological Scenario 3.4.1.1 3D Printed Nano Satellite 3.4.1.2 On-Board Internet System Powered Nano Satellite 3.4.2 Patent Analysis 3.5 Value Chain Analysis 3.6 Industry Attractiveness 3.6.1 Bargaining power of suppliers 3.6.2 Bargaining power of buyers 3.6.3 Threat of new entrants 3.6.4 Threat of substitutes 3.6.5 Intensity of competitive rivalry 4 Global Nano Satellite Market 4.1 Assumptions and Limitations 4.2 Market Overview 4.2.1 Market Definition 4.2.2 Nano Satellite Missions: 2012-2021 5 Nano Satellite Market by Subsystem 5.1 Market Overview 5.2 Payload 5.3 Structure 5.4 Telecommunication 5.5 On-Board Computer 5.6 Power System 5.7 Attitude Control System 5.8 Propulsion System 6 Nano Satellite Market by End User 6.1 Market Overview 6.2 Academic 6.2.1 Nano Satellite Market Analysis for Academic End User by Application 6.3 Commercial 6.3.1 Nano Satellite Market Analysis for Commercial End User by Application 6.4 Government 6.4.1 Nano Satellite Market Analysis for Government End User by Application 6.5 Defense 6.5.1 Nano Satellite Market Analysis for Defense End User by Application 6.6 Non-Profit Organization 6.6.1 Nano Satellite Market Analysis for www.bisresearch.com
Global Nano Satellite Market - Analysis and Forecast 2017-2021 TABLE OF CONTENTS 9 Company Profile 9.1 Ball Corporation 9.1.1 Company Overview 9.1.2 Product Offerings 9.1.3 Financials 9.1.3.1 Overall Financials 9.1.3.2 Segment Revenue Mix 9.1.3.3 Geographic Revenue Mix 9.1.4 SWOT Analysis 9.2 Clyde Space Ltd. 9.2.1 Company Overview 9.2.2 Product Offerings 9.3 Deep Space Industries, Inc. 9.3.1 Company Overview 9.3.2 Product Offerings 9.3.3 Key Missions 9.4 Innovative Solutions in Space BV 9.4.1 Company Overview 9.4.2 Product Offerings 9.4.3 Upcoming Small Satellite Launches, 2017-2020 9.5 Interorbital Systems 9.5.1 Company Overview 9.5.2 Product Offerings 9.6 Israel Aerospace Industries Ltd. 9.6.1 Company Overview 9.6.2 Product Offerings 9.6.3 Financials 9.6.3.1 Overall Financials 9.6.3.2 Segment Revenue Mix 9.6.4 Key Development Strategies 9.7 Lockheed Martin Corporation 9.7.1 Company Overview 9.7.2 Product Offerings 9.7.3 Financials 9.7.3.1 Overall Financials 9.7.3.2 Segment Revenue Mix 9.7.3.3 Geographic Revenue Mix 9.7.4 SWOT Analysis 9.8 NanoAvionika, LLC Non-Profit Organization End User by Application 7 Nano Satellites Market By Application 7.1 Market Overview 7.2 Communication 7.3 Intelligence, Surveillance & Reconnaissance (ISR) 7.4 Earth Observation & Remote Sensing 7.5 Academic Research & Space Exploration 7.6 Navigation 7.7 Technology Demonstration 8 Nano Satellite Market by Geography 8.1 Market Overview 8.2 North America 8.2.1 North American Nano Satellite Market by End User 8.2.2 U.S. 8.2.3 Canada 8.3 Europe 8.3.1 European Nano Satellite Market by End User 8.3.2 UK 8.3.3 Germany 8.3.4 France 8.3.5 Russia 8.3.6 Spain 8.3.7 Rest of Europe 8.4 Asia-Pacific 8.4.1 Asia-Pacific Nano Satellite Market by End User 8.4.2 China 8.4.3 India 8.4.4 Japan 8.4.5 South Korea 8.4.6 Rest of Asia-Pacific 8.5 Rest of the World 8.5.1 Rest of the World Nano Satellite Market by End User 8.5.2 Middle East 8.5.3 Latin America 8.5.4 Africa www.bisresearch.com
Global Nano Satellite Market - Analysis and Forecast 2017-2021 TABLE OF CONTENTS 9.15 The Boeing Company 9.15.1 Company Overview 9.15.2 Product Offerings 9.15.3 Financials 9.15.3.1 Overall Financials 9.15.3.2 Segment Revenue Mix 9.15.3.3 Geographic Revenue Mix 9.15.4 SWOT Analysis 10 Appendix 10.1 Related Reports 9.14.3 Key Development 9.9 Northrop Grumman Corporation 9.9.1 Company Overview 9.9.2 Product Offerings 9.9.3 Financials 9.9.3.1 Overall Financials 9.9.3.2 Segment Revenue Mix 9.9.3.3 Geographic Revenue Mix 9.9.4 SWOT Analysis 9.10 OHB SE 9.10.1 Company Overview 9.10.2 Product Offerings 9.10.3 Financials 9.10.3.1 Overall Financials 9.10.3.2 Segment Revenue Mix 9.10.4 SWOT Analysis 9.11 Orbital ATK, Inc. 9.11.1 Company Overview 9.11.2 Product Offerings 9.11.3 Financials 9.11.3.1 Overall Financials 9.11.3.2 Segment Revenue Mix 9.11.4 SWOT Analysis 9.12 Planet Labs, Inc. 9.12.1 Company Overview 9.12.2 Product Offerings 9.12.3 Key Development Strategies 9.13 QinetiQ Group PLC 9.13.1 Company Overview 9.13.2 Product Offerings 9.13.3 Financials 9.13.3.1 Overall Financials 9.13.3.2 Segment Revenue Mix 9.13.3.3 Geographic Revenue Mix 9.13.4 SWOT Analysis 9.14 Terra Bella 9.14.1 Company Overview 9.14.2 Product Offerings 9.8.1 Company Overview 9.8.2 Product Offerings 9.8.3 Ongoing Projects www.bisresearch.com
Global Nano Satellite Market - Analysis and Forecast 2017-2021 LIST OF TABLE Table 3.1 New Product Launch Table 3.2 Collaborations Table 3.3 Contracts Table 3.4 Others Table 3.5 Patent Analysis: Deployable Helical Antenna for Nano Satellites Table 3.6 Patent Analysis: Nano Satellite Photovoltaic Regulator Table 3.7 Patent Analysis: Computerized Nano Satellite Platform for Large Ocean Vessel Tracking Table 3.8 Patent Analysis: Separable Micro and Nano Satellite Configuration Table 3.9 Patent Analysis: Novel Nano Satellite Structure with Self-Carrying Launching Function Table 3.10 Product Mapping With Respect to Application Table 4.1 Payload Ranges for Satellites Table 5.1 Nano Satellite Market by Subsystem, 2016-2021 ($Million) Table 6.1 Nano Satellite Market by End User, 2016-2021 ($Million) Table 7.1 Nano Satellite Market by Application, 2016-2021 ($Million) Table 7.2 Nano Satellite Launches for Communication Application Table 7.3 Nano Satellite Launches for Intelligence, Surveillance, & Reconnaissance (ISR) Application Table 7.4 Nano Satellite Launches for Earth Observation & Remote Sensing Application Table 7.5 Nano Satellite Launches for Academic Research & Space Exploration Application Table 7.6 Nano Satellite Launches for Technology Demonstration Application Table 8.1 Nano Satellite Market Size by Geography, 2016-2021 ($Million) www.bisresearch.com
Global Nano Satellite Market - Analysis and Forecast 2017-2021 LIST OF FIGURES Figure 5.1 Classification of Nano Satellite Market by Subsystem Figure 5.2 Nano Satellite Market by Subsystem, 2016-2021 ($Million) Figure 5.3 Nano Satellite Market by Payload Subsystem, 2016-2021 ($Million) Figure 5.4 Nano Satellite Market Penetration in Payload Subsystem, 2016-2021 (%) Figure 5.5 Nano Satellite Market by Structure Subsystem, 2016-2021 ($Million) Figure 5.6 Nano Satellite Market Penetration in Structure Subsystem, 2016-2021 (%) Figure 5.7 Nano Satellite Market by Telecommunication Subsystem, 2016-2021 ($Million) Figure 5.8 Nano Satellite Market Penetration in Telecommunication Subsystem, 2016-2021 (%) Figure 5.9 Nano Satellite Market by On-Board Computer Subsystem, 2016-2021 ($Million) Figure 5.10 Nano Satellite Market Penetration in On-Board Computer Subsystem, 2016-2021 (%) Figure 5.11 Nano Satellite Market by Power System Subsystem, 2016-2021 ($Million) Figure 5.12 Nano Satellite Market Penetration in Power System Subsystem, 2016- 2021 (%) Figure 5.13 Nano Satellite Market by Attitude Control Subsystem, 2016-2021 ($Million) Figure 5.14 Nano Satellite Market Penetration in Attitude Control System Subsystem, 2016-2021 (%) Figure 5.15 Nano Satellite Market by Propulsion System Subsystem, 2016-2021 ($Million) Figure 5.16 Nano Satellite Market Penetration in Propulsion System Subsystem, 2016-2021 (%) Figure 6.1 Classification of Nano Satellite Market by End User and Key Players Figure 1 Space Budget of NASA, 2016-2020 ($Million) Figure 2 Global Nano Satellite Market by Subsystem, 2016-2021 ($Million) Figure 3 Global Nano Satellite Market by End User, 2016-2021 ($Million) Figure 4 Global Nano Satellite Market by Application, 2016-2021 ($Million) Figure 5 Global Nano Satellite Market by Geography, 2016-2021 Figure 1.1 Nano Satellite Market Segmentation Figure 1.2 Secondary Data Sources Figure 1.3 Top Down and Bottom up Approach Figure 1.4 Nano Satellite Market Influencing Factors Figure 1.5 Assumptions and Limitations Figure 2.1 Nano Satellite: Market Dynamics Figure 2.2 Nano Satellite: Growth Roadmap Figure 2.3 Major Satellite Constellation Launches: 1990 - 2020 Figure 2.4 NASA’s Global Precipitation Measurement (GPM) Constellation: Member Satellites and Nations Figure 2.5 Nano Satellite: Remote Sensing for Disaster Management Figure 2.6 GNSS Operational Constellations Figure 2.7 Top Impacting Factors: 2017 & 2023 Figure 3.1 Share of Development and Strategies Figure 3.2 Nano Satellite: Competitive Benchmarking Figure 3.3 3D Printing Scenario for Different Industries Figure 3.4 Nano Satellite: Value Chain Analysis Figure 3.5 Nano Satellite: Porter’s Five Forces Figure 3.6 Bargaining Power of Suppliers Figure 3.7 Bargaining Power of Buyers Figure 3.8 Threat of New Entrants Figure 3.9 Threat of Substitutes Figure 3.10 Intensity of Competitive Rivalry Figure 4.1 Global Nano Satellite Market by Value 2016-2021 ($Million) Figure 4.2 Small Satellite Launches: 2012-2020 www.bisresearch.com
Global Nano Satellite Market - Analysis and Forecast 2017-2021 LIST OF FIGURES Figure 7.3 Nano Satellite Market by Communication Application, 2016- 2021 ($Million) Figure 7.4 Nano Satellite Market Analysis for Communication Application by Geography, 2016–2021 ($Million) Figure 7.5 Nano Satellite Market by Intelligence, Surveillance, & Reconnaissance (ISR) Application, 2016-2021 ($Million) Figure 7.6 Nano Satellite Market Analysis for Intelligence, Surveillance & Reconnaissance (ISR) Application by Geography, 2016–2021 ($Million) Figure 7.7 Nano Satellite Market for Earth Observation & Remote Sensing Application Figure 7.8 Nano Satellite Market by Earth Observation & Remote Sensing Application, 2016-2021 ($Million) Figure 7.9 Nano Satellite Market Analysis for Earth Observation & Remote Sensing Application by Geography, 2016– 2021 ($Million) Figure 7.10 Worldwide Academic Research & Space Exploration Organisations Figure 7.11 Nano Satellite Market by Academic Research & Space Exploration Application, 2016-2021 ($Million) Figure 7.12 Nano Satellite Market Analysis for Academic Research & Space Exploration Application by Geography, 2016–2021 ($Million) Figure 7.13 Modernised GPS: Civil Signals Figure 7.14 Nano Satellite Market by Navigation Application, 2016-2021 ($Million) Figure 7.15 Nano Satellite Market Analysis for Navigation Application by Geography, 2016–2021 ($Million) Figure 7.16 Nano Satellite Market by Technology Demonstration Application, 2016-2021 ($Million) Figure 7.17 Nano Satellite Market Analysis for Technology Demonstration Application by Geography, 2016– 2021 ($Million) Figure 6.2 Nano Satellite Market by End User, 2016-2021 ($Million) Figure 6.3 Nano Satellite Market by Academic End User, 2016-2021 ($Million) Figure 6.4 Nano Satellite Market Analysis for Academic End User by Application, 2016–2021 ($Million) Figure 6.5 Nano Satellites Launched by Academic End Users, 2012-2016 Figure 6.6 Nano Satellite Market by Commercial End User, 2016-2021 ($Million) Figure 6.7 Nano Satellite Market Analysis for Commercial End User by Application, 2016–2021 ($Million) Figure 6.8 Nano Satellites Launched by Commercial End Users, 2012-2016 Figure 6.9 Nano Satellite Market by Government End User, 2016-2021 ($Million) Figure 6.10 Nano Satellite Market Analysis for Government End User by Application, 2016–2021 ($Million) Figure 6.11 Nano Satellites Launched by Government End Users, 2012-2016 Figure 6.12 Nano Satellite Market by Defense End User, 2016-2021 ($Million) Figure 6.13 Nano Satellite Market Analysis for Defense End User by Application, 2016–2021 ($Million) Figure 6.14 Nano Satellites Launched by Defense End Users, 2012-2016 Figure 6.15 Nano Satellite Market by Non-Profit Organization End User, 2016-2021 ($Million) Figure 6.16 Nano Satellite Market Analysis for Non-Profit Organization End User by Application, 2016–2021 ($Million) Figure 6.17 Nano Satellites Launched by Non- Profit Organization End Users, 2013-2017 Figure 7.1 Classification of Nano Satellite Market by Application, Market Share (%) 2016 Figure 7.2 Nano Satellite Market by Application 2016-2021 ($Million) www.bisresearch.com
Global Nano Satellite Market - Analysis and Forecast 2017-2021 LIST OF FIGURES Figure 8.23 Rest of the World Nano Satellite Market by End User Figure 8.24 Middle Eastern Nano Satellite Market Size, 2016-2021 ($Million) Figure 8.25 Latin American Nano Satellite Market Size, 2016-2021 ($Million) Figure 8.26 African Nano Satellite Market Size, 2016-2021 ($Million) Figure 9.1 Ball Corporation: Product Offerings Figure 9.2 Ball Corporation – Overall Financials, 2014-2016 Figure 9.3 Ball Corporation – Business Segment Revenue Mix, 2014-2016 Figure 9.4 Ball Corporation – Geographic Revenue Mix, 2014-2016 Figure 9.5 Clyde Space Ltd.: Product Offerings Figure 9.6 Deep Space Industries Inc.: Product Offerings Figure 9.7 Deep Space Industries Inc. - Missions Figure 9.8 Innovative Solutions in Space BV: Product Offerings Figure 9.9 Innovative Solutions in Space BV – Upcoming Small Satellite Launches, 2017-2020 Figure 9.10 Interorbital Systems: Product Offerings Figure 9.11 Israel Aerospace Industries Ltd.: Product Offerings Figure 9.12 Israel Aerospace Industries Ltd. – Overall Financials, 2014-2016 Figure 9.13 Israel Aerospace Industries Ltd. – Business Segment Revenue Mix, 2014-2016 Figure 9.14 Figure 9.15 Lockheed Martin Corporation: Product Offerings Figure 9.16 Lockheed Martin Corporation – Overall Financials, 2014-2016 Figure 9.17 Lockheed Martin Corporation – Business Segment Revenue Mix, 2014-2016 Figure 9.18 Lockheed Martin Corporation – Geographic Revenue Mix, 2014- Figure 8.1 Classification of Nano Satellites Market by Geography Figure 8.2 Geographic Distribution of Nano Satellite Market, 2016-2021 Figure 8.3 North American Nano Satellite Market by Country Figure 8.4 North American Nano Satellite Market by End User Figure 8.5 U.S. Nano Satellite Market Size, 2016-2021 ($Million) Figure 8.6 Canadian Nano Satellite Market Size, 2016-2021 ($Million) Figure 8.7 European Nano Satellite Market by Country Figure 8.8 European Nano Satellite Market by End User Figure 8.9 UK Nano Satellite Market Size, 2016- 2021 ($Million) Figure 8.10 Germany Nano Satellite Market Size, 2016-2021 ($Million) Figure 8.11 France Nano Satellite Market Size, 2016-2021 ($Million) Figure 8.12 Russian Nano Satellite Market Size, 2016-2021 ($Million) Figure 8.13 Spain Nano Satellite Market Size, 2016-2021 ($Million) Figure 8.14 Rest of Europe Nano Satellite Market Size, 2016-2021 ($Million) Figure 8.15 Asia-Pacific Nano Satellite Market by Country Figure 8.16 Asia-Pacific Nano Satellite Market by End User Figure 8.17 China Nano Satellite Market Size, 2016-2021 ($Million) Figure 8.18 Indian Nano Satellite Market Size, 2016-2021 ($Million) Figure 8.19 Japan Nano Satellite Market Size, 2016-2021 ($Million) Figure 8.20 South Korean Nano Satellite Market Size, 2016-2021 ($Million) Figure 8.21 Rest of Asia-Pacific Nano Satellite Market Size, 2016-2021 ($Million) Figure 8.22 Rest of the World Nano Satellite Market by Region www.bisresearch.com
Global Nano Satellite Market - Analysis and Forecast 2017-2021 LIST OF FIGURES Segment Revenue Mix, 2014-2016 Figure 9.42 The Boeing Company – Geographic Revenue Mix, 2014-2016 2016 Figure 9.19 NanoAvionika, LLC: Product Offerings Figure 9.20 NanoAvionika, LLC – Ongoing Projects Figure 9.21 Northrop Grumman Corporation: Product Offerings Figure 9.22 Northrop Grumman Corporation – Overall Financials, 2014-2016 Figure 9.23 Northrop Grumman Corporation – Business Segment Revenue Mix, 2014-2016 Figure 9.24 Northrop Grumman Corporation – Geographic Revenue Mix, 2014- 2016 Figure 9.25 OHB SE: Product Offerings Figure 9.26 OHB SE – Overall Financials, 2014- 2016 Figure 9.27 OHB SE – Business Segment Revenue Mix, 2014-2016 Figure 9.28 Orbital ATK, Inc.: Product Offerings Figure 9.29 Orbital ATK, Inc. – Overall Financials, 2014-2016 Figure 9.30 Orbital ATK, Inc. – Business Segment Revenue Mix, 2014-2016 Figure 9.31 Planet Labs, Inc.: Product Offerings Figure 9.32 Planet Labs, Inc. – Key Developments Strategies Figure 9.33 QinetiQ Group PLC: Product Offerings Figure 9.34 QinetiQ Group PLC – Overall Financials, 2014-2016 Figure 9.35 QinetiQ Group PLC – Business Segment Revenue Mix, 2014-2016 Figure 9.36 QinetiQ Group PLC – Geographic Revenue Mix, 2014-2016 Figure 9.37 Terra Bella: Product Offerings Figure 9.38 Terra Bella – Key Developments Figure 9.39 The Boeing Company: Product Offerings Figure 9.40 The Boeing Company – Overall Financials, 2014-2016 Figure 9.41 The Boeing Company – Business www.bisresearch.com
Global Nano Satellite Market - Analysis and Forecast 2017-2021 DISCLAIMER BIS Research provides valuable market intelligence to an exclusive group of customers in response to orders. The report is licensed for the customer’s internal use only and is subject to restrictions set henceforth. This document and its contents are confidential and may not be further distributed, published or reproduced, in whole or in part, by any medium or in any form for any purpose, without the express written consent of BIS Research. Customer will not disclose the contents of the report, whether directly in any media or indirectly through incorporation in a database, marketing list, report or otherwise, or use or permit the use of Information to generate any statistical or other information that is or will be provided to third parties; or voluntarily produce Information in legal proceedings. Market reports are based on expectations, estimates and projections as of the date such information is available. Any recommendation contained in this report may not be suitable for all investors or businesses. The market conclusions drawn are necessarily based upon a number of estimates and assumptions that, while considered reasonable by BIS Research as of the date of such statements, are inherently subject to market fluctuations and business, economic and competitive uncertainties and contingencies. For more details regarding permission, please contact us: Email: sales@bisresearch.com Tel: +1 650 228 0182 www.bisresearch.com