Download
1 / 14
140 likes | 238 Views
The main sensors used in intelligent lighting industry are ambient light sensors, proximity sensors, occupancy sensors, photo sensors, and daylight sensors.

E N D
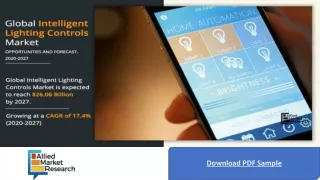
Global Intelligent Lighting Controls Market – Analysis and Forecast (2017-2023) The future global economy is anticipated to consume more energy resources in the longer run, especially with the growing energy demand from the developing countries such as China and India. Lighting segment usually consumes majority of the electricity in a commercial building, and draws substantial energy levels for a private residence. Intelligent lighting controls continue to propel the lighting industry towards growth with increasing revenue at a global level. Intelligent lighting controls witnessed a major increase in the adoption rate for the usage in various applications due to several advancements offered by the technology. The intelligent lighting controls market is expected to grow at a significant rate during the forecast period. This is due to integration of physical security industry with intelligent lighting, changing paradigm of lighting control industry to electronics industry and adding voice control feature to the upcoming products. Increasing smart homes market along with customization benefits and continuously decreasing average selling price (ASP) of LED bulbs and drivers are some of the factors driving the growth of intelligent lighting control market. The global intelligent lighting control market is estimated to witness a growth at a CAGR of 14.3% and 10.2% over the period 2017 to 2023 in terms of volume and value respectively. North America led the global intelligent lighting controls market in 2016 in terms of volume and value. Since energy performance contracts are becoming widespread in North America, specific Energy Service Companies (ESCOs) have been developed in last few years to provide wide-ranging energy services to the owners of buildings. The services offered in a form of package, include equipment installations, technical evaluations, hazardous waste removal, billing, financing, energy monitoring and verification services. The growth of North American intelligent lighting control market is actively supported by the installation of new intelligent lighting systems in the non-residential segment. However, Asia Pacific is expected to grow with the highest rate during the forecast period and surpass the market of Europe. This is mainly due to lower cost of consumer equipment in the region. Additionally, the rising trend of smart homes in the region is also supporting the growth of Asia Pacific intelligent lighting controls market. China has a high rate of consumption and production of global lighting products. Within the lighting industry, intelligent lighting enterprises are gradually on the path of expansion which is also attracting many foreign market players for further investments. Additionally, growth of green lighting LED lamps is rising in the China lighting industry. The most often used strategy for developing a better hold on to the market has been through product launches, followed by partnerships, joint ventures, and collaborations. Moreover, the company profile section includes highlights of significant information about the key companies involved along with their financial positions, key strategies, and developmental activities of recent years. Some of the key players involved in this market are General Electric, Lutron Electronics Co. Inc., Leviton Manufacturing Co. Inc., Honeywell International Inc., Acuity Brands Inc., Cree Inc., Enlighted Inc., Daintree Networks, Koninklijke Philips N.V., OSRAM Licht AG, Legrand, Hubbell Incorporated, LSI Industries Inc., Control4 Corporation, EATON, and Schneider Electric. www.bisresearch.com
Global Intelligent Lighting Controls Market – Analysis and Forecast (2017-2023) The report is a compilation of different segments of global intelligent lighting controls market including market breakdown by component type, connection type, light source, and application. The report also discusses in detail about the key participants involved in the industry. The report answers the following questions about the global intelligent lighting controls market: • What are the prevailing component types, connection types and light sources used in intelligent lighting controls? • What are the different application areas of intelligent lighting controls? • What are the different factors driving the market in the forecast period? • What are the factors restraining the growth of global intelligent lighting controls market? • Who are the different participants in the global intelligent lighting controls market? • What kind of new strategies are being adopted by existing market players to make a mark in the industry? • Which region will lead the global intelligent lighting controls market by the end of forecast period? Intelligent Lighting Controls Market Size, Intelligent Lighting Controls Market Size, CAGR 10.2% CAGR 14.3% (Million Units) ($Million) XX XX XX XX XX XX 2016 2016 2023 2023 2017 2017 www.bisresearch.com
Global Intelligent Lighting Controls Market – Analysis and Forecast (2017-2023) Analysis & Forecast: Base Year: 2016 Estimated Year: 2017 6 Year Annual Estimated Forecast (2017-2023) Market, by Component Type: Sensors, Ballasts and LED Drivers, Microprocessors and Microcontrollers, Switches and Dimmers, and Transmitters and Receivers Market, By Connection Type: Wired and Wireless Market, By Light Source: Fluorescent Light (FL), Light Emitting Diode (LED) Lamps, and High Intensity Discharge (HID) Lamps Market, By Application: Commercial Application, Outdoor Application, Residential Application, Industrial Application and Automotive Market, By Geography: North America (U.S., Canada and Others), Europe (Germany, U.K., France, Spain and Others), Asia-Pacific (China, India, Japan, South Korea, and Others), and Rest of the World (Latin America, and Middle East and Africa) www.bisresearch.com
Global Intelligent Lighting Controls Market – Analysis and Forecast (2017-2023) TABLE OF CONTENTS Executive Summary 1 Research Scope & Methodology 1.1 Scope of the Report 1.2 Intelligent Lighting Control Market Research Methodology 2 Market Dynamics 2.1 Market Drivers 2.1.1 Prevailing Issue of Global Energy Crisis 2.1.2 Increasing Trend of Smart Homes Along with Customization Benefits 2.1.3 Continuously Declining Average Selling Price (ASP) of LED Bulbs and LED Drivers 2.2 Market Opportunities 2.2.1 The Integration of Physical Security Industry with Intelligent Lighting Industry 2.2.2 Changing Paradigm of Lighting Industry to Electronics Industry 2.2.3 Addition of Voice Control Feature to the Upcoming Products 2.3 Market Restraints 2.3.1 Designing Challenges While Using LED Driver 2.3.2 Consumers have to Bear High Replacement Costs from Existing Solutions to Intelligent Lighting Systems 2.3.3 Lack of Standards and the Associated Interoperability Issues 3 Competitive Insight 3.1 Key Strategies and Developments 3.1.1 Partnerships, Joint Ventures, Collaborations and Contracts 3.1.2 New Product Launches, Developments and Expansions 3.1.3 Mergers and Acquisitions 3.1.4 Business Expansion and Certification 3.1.5 Other Developments 3.2 Lighting Industry Trends 3.2.1 Cloud-Based Lighting Controls 3.2.2 Light Fidelity (LiFi) Becoming a Brighter Way to Communicate 3.2.3 OLED Panel Shipments on the Rise 3.2.4 LED Filament Bulbs Equivalent of Incandescent Bulb with LED Lamp Benefits 3.3 Industry Attractiveness 3.3.1 Threat of New Entrants 3.3.2 Bargaining Power of Buyers 3.3.3 Bargaining Power of Suppliers 3.3.4 Threat from Substitutes 3.3.5 Intensity of Competitive Rivalry 3.4 Leading Player Analysis 3.5 R&D Analysis of Leading Players in Intelligent Lighting Controls Market 4 Global Intelligent Lighting Controls Market by Component Type 4.1 Assumptions and Limitations 4.2 Market Overview 4.3 Component Type Market Overview 4.4 Sensors: Most Essential Control for Directing the Lighting Conditions 4.4.1 Sensors Market Overview 4.4.2 Sensors Market by Application 4.4.3 Sensors Market by Connection Type 4.4.4 Sensors Market by Region 4.5 Fluorescent Ballasts and LED Drivers: Heart of Fluorescent and LED Lighting 4.5.1 Ballasts and LED Drivers Market Overview 4.5.2 Ballasts and LED Drivers Market by Application 4.5.3 Ballasts and LED Drivers Market by Connection Type 4.5.4 Ballasts and LED Drivers Market by Region 4.6 Microprocessors and Microcontrollers: Enable Intelligent Management of Light Settings with Optimum Efficiency 4.6.1 Microprocessors and Microcontrollers Market Overview 4.6.2 Microprocessors and Microcontrollers Market by Application 4.6.3 Microprocessors and Microcontrollers Market by Connection Type 4.6.4 Microprocessors and Microcontrollers Market by Region 4.7 Switches and Dimmers 4.7.1 Switches and Dimmers Market www.bisresearch.com
Global Intelligent Lighting Controls Market – Analysis and Forecast (2017-2023) TABLE OF CONTENTS 7.6 Automotive Application 8 Global Intelligent Lighting Controls Market by Region 8.1 Introduction 8.2 North America Market by Country 8.3 Asia Pacific Market by Country 8.4 Europe Market by Country 8.5 Rest of the World Market by Country 9 Company Profile 9.1 General Electric 9.1.1 Company Overview 9.1.2 Financials 9.1.2.1 Overall Financials 9.1.2.2 Segment Revenue Mix 9.1.2.3 Geographic Revenue Mix 9.1.2.4 Financial Summary 9.1.3 SWOT Analysis 9.2 Lutron Electronics Co., Inc. 9.2.1 Company Overview 9.2.2 Corporate Summary 9.2.3 SWOT Analysis 9.3 Leviton Manufacturing Co., Inc. 9.3.1 Company Overview 9.3.2 Corporate Summary 9.3.3 SWOT Analysis 9.4 Honeywell International Inc. 9.4.1 Company Overview 9.4.2 Financials 9.4.2.1 Overall Financials 9.4.2.2 Segment Revenue Mix 9.4.2.3 Geographic Revenue Mix 9.4.2.4 Financial Summary 9.4.3 SWOT Analysis 9.5 Acuity Brands, Inc. 9.5.1 Company Overview 9.5.2 Financials 9.5.2.1 Overall Financials 9.5.2.2 Geographic Revenue Mix 9.5.2.3 Financial Summary 9.5.3 SWOT Analysis 9.6 Cree, Inc. 9.6.1 Company Overview 9.6.2 Financials Overview 4.7.2 Switches and Dimmers Market by Application 4.7.3 Switches and Dimmers Market by Connection Type 4.7.4 Switches and Dimmers Market by Region 4.8 Transmitters and Receivers 4.8.1 Transmitters and Receivers Market Overview 4.8.2 Transmitters and Receivers Market by Application 4.8.3 Transmitters and Receivers Market by Connection Type 4.8.4 Transmitters and Receivers Market by Region 5 Global Intelligent Lighting Market by Connection Type 5.1 Connection Type Market Overview 5.2 Wired Technology 5.2.1 Building Automation & Control Network (BACnet) 5.2.2 Digital Addressable Lighting Interface (DALI) 5.2.3 Power Line Communication (PLC) 5.2.4 Proprietary Control 5.2.5 Others 5.3 Wireless Technology 5.3.1 EnoCean 5.3.2 ZigBee 5.3.3 Bluetooth 5.3.4 Wi-Fi 6 Global Intelligent Lighting Controls Market by Light Source 6.1 Light Source Market Overview 6.2 Fluorescent Lamp (FL) 6.3 Light Emitting Diode (LED) 6.4 High Intensity Discharge (HID) Lamps 7 Global Intelligent Lighting Controls Market by Applications 7.1 Applications Market Overview 7.2 Residential Application – Smart Homes Creating the BUZZ 7.3 Commercial Application 7.4 Industrial Application 7.5 Outdoor Application www.bisresearch.com
Global Intelligent Lighting Controls Market – Analysis and Forecast (2017-2023) TABLE OF CONTENTS 9.15 CONTROL4 CORPORATION 9.15.1 Company Overview 9.15.2 Financials 9.15.2.1 Overall Financials 9.15.2.2 Geographic Revenue Mix 9.15.2.3 Financial Summary 9.15.3 SWOT Analysis 9.16 EATON 9.16.1 Company Overview 9.16.2 Financials 9.16.2.1 Overall Financials 9.16.2.2 Segment Revenue Mix 9.16.2.3 Geographic Revenue Mix 9.16.2.4 Financial Summary 9.16.3 SWOT Analysis 9.17 Schneider Electric 9.17.1 Company Overview 9.17.2 Financials 9.17.2.1 Overall Financials 9.17.2.2 Segment Revenue Mix 9.17.2.3 Geographic Revenue Mix 9.17.2.4 Financial Summary 9.17.3 SWOT Analysis 9.14.2 Financials 9.14.2.1 Overall Financials 9.14.2.2 Segment Revenue Mix 9.14.2.3 Geographic Revenue Mix 9.14.2.4 Financial Summary 9.14.3 SWOT Analysis 9.7 Enlighted Inc. 9.7.1 Company Overview 9.7.2 Corporate Summary 9.8 Digital Lumens, Inc. 9.8.1 Company Overview 9.8.2 Corporate Summary 9.9 Daintree Networks 9.9.1 Company Overview 9.9.2 Corporate Summary 9.9.3 SWOT Analysis 9.10 Koninklijke Philips N.V. 9.10.1 Company Overview 9.10.2 Financials 9.10.2.1 Overall Financials 9.10.2.2 Segment Revenue Mix 9.10.2.3 Geographic Revenue Mix 9.10.2.4 Financial Summary 9.10.3 SWOT Analysis 9.11 OSRAM Licht AG 9.11.1 Company Overview 9.11.2 Financials 9.11.2.1 Overall Financials 9.11.2.2 Segment Revenue Mix 9.11.2.3 Geographic Revenue Mix 9.11.2.4 Financial Summary 9.11.3 SWOT Analysis 9.12 Legrand 9.12.1 Company Overview 9.12.2 Financials 9.12.2.1 Overall Financials 9.12.2.2 Geographic Revenue Mix 9.12.2.3 Financial Summary 9.12.3 SWOT Analysis 9.13 Hubbell Incorporated 9.13.1 Company Overview 9.13.2 Corporate Summary 9.14 LSI Industries, Inc. 9.14.1 Company Overview 9.6.3 SWOT Analysis 9.6.2.1 Overall Financials 9.6.2.2 Segment Revenue Mix 9.6.2.3 Geographic Revenue Mix 9.6.2.4 Financial Summary www.bisresearch.com
Global Intelligent Lighting Controls Market – Analysis and Forecast (2017-2023) LIST OF TABLE Table 1 Comparison Between Various Lightings Table 2.1 Product Life and Energy Efficiencies of Different Lamps Table 2.2 Per Unit Price of Different Lamp Technologies Table 3.1 Partnerships, Joint Ventures, Collaborations and Contracts Table 3.2 New Product Launches, Developments and Expansions Table 3.3 Key Mergers and Acquisitions Table 3.4 Key Business Expansion Table 3.5 Other Developments Table 4.1 Component Type Market Size, 2016- 2023 (Units Million) Table 4.2 Component Type Market Size, 2016- 2023 ($Million) Table 4.3 Global Sensors Market Breakdown by Application, Units Million (2016 – 2023) Table 4.4 Global Sensors Market Breakdown by Application, $Million (2016 – 2023) Table 4.5 Global Sensors Market Breakdown by Connection Type, Units Million (2016 – 2023) Table 4.6 Global Sensors Market Breakdown by Connection Type, $Million (2016 – 2023) Table 4.7 Global Sensors Market Breakdown by Region, Units Million (2016 – 2023) Table 4.8 Global Sensors Market Breakdown by Region, $Million (2016 – 2023) Table 4.9 Recommended Sockets for Different Fluorescent Lamps Type Table 4.10 Global Ballasts and LED Drivers Market Breakdown by Application, Units Million (2016 – 2023) Table 4.11 Global Ballasts and LED Drivers Market Breakdown by Application, $Million (2016 – 2023) Table 4.12 Global Ballasts and LED Drivers Market Breakdown by Connection Type, Units Million (2016 – 2023) Table 4.13 Global Ballasts and LED Drivers Market Breakdown by Connection Type, $Million (2016 – 2023) Table 4.14 Global Ballasts and LED Drivers Market Breakdown by Region, Units Million (2016 – 2023) Table 4.15 Global Ballasts and LED Drivers Market Breakdown by Region, $Million (2016 – 2023) Table 4.16 Global Microprocessors and Microcontrollers Market Breakdown by Application, Units Million (2016 – 2023) Table 4.17 Global Microprocessors and Microcontrollers Market Breakdown by Application, $Million (2016 – 2023) Table 4.18 Global Microprocessors and Microcontrollers Market Breakdown by Connection Type, Units Million (2016 – 2023) Table 4.19 Global Microprocessors and Microcontrollers Market Breakdown by Connection Type, $Million (2016 – 2023) Table 4.20 Global Microprocessors and Microcontrollers Market Breakdown by Region, Units Million (2016 – 2023) Table 4.21 Global Microprocessors and Microcontrollers Market Breakdown by Region, $Million (2016 – 2023) Table 4.22 Global Switches and Dimmers Market Breakdown by Application, Units Million (2016 – 2023) www.bisresearch.com
Global Intelligent Lighting Controls Market – Analysis and Forecast (2017-2023) LIST OF TABLE Table 4.23 Global Switches and Dimmers Market Breakdown by Application, $Million (2016 – 2023) Table 4.24 Global Switches and Dimmers Market Breakdown by Connection Type, Units Million (2016 – 2023) Table 4.25 Global Switches and Dimmers Market Breakdown by Connection Type, $Million (2016 – 2023) Table 4.26 Global Switches and Dimmers Market Breakdown by Region, Units Million (2016 – 2023) Table 4.27 Global Switches and Dimmers Market Breakdown by Region, $Million (2016 – 2023) Table 4.28 Global Transmitters and Receivers Market Breakdown by Application, Units Million (2016 – 2023) Table 4.29 Global Transmitters and Receivers Market Breakdown by Application, $Million (2016 – 2023) Table 4.30 Global Transmitters and Receivers Market Breakdown by Connection Type, Units Million (2016 – 2023) Table 4.31 Global Transmitters and Receivers Market Breakdown by Connection Type, $Million (2016 – 2023) Table 4.32 Global Transmitters and Receivers Market Breakdown by Region, Units Million (2016 – 2023) Table 4.33 Global Transmitters and Receivers Market Breakdown by Region, $Million (2016 – 2023) Table 5.1 Connection Type Market Size, 2016- 2023 (Units Million) Table 5.2 Connection Type Market Size, 2016- 2023 ($Million) Table 5.3 Advantages and Disadvantages of Wi- Fi Technology Table 6.1 Intelligent Lighting Controls Market Size by Light Source, 2016-2023 (Units Million) Table 6.2 Intelligent Lighting Controls Market Size by Light Source, 2016-2023 ($Million) Table 7.1 Intelligent Lighting Controls Market Size by Applications, 2016-2023 (Units Million) Table 7.2 Intelligent Lighting Controls Market Size by Applications, 2016-2023 ($Million) Table 7.3 Company Mapping for Interior Lighting Table 7.4 Company Mapping for Exterior Lighting Table 7.5 Company Mapping for Application Based Lighting Table 7.6 Company Mapping for Voice Controlled Lighting Table 7.7 Company Mapping for Shops, Retail & Grocery Store Lighting Table 7.8 Company Mapping for Restaurant Lighting Table 7.9 Company Mapping for Hotel Lighting Table 7.10 Company Mapping for Sports Arena and Stadium Lighting Table 7.11 Company Mapping for Corporate Office Lighting Table 7.12 Company Mapping for Warehouse Lighting Table 7.13 Company Mapping for Production Hall Lighting Table 7.14 Company Mapping for Outdoor Storage Areas Lighting Table 7.15 Company Mapping for Entrance areas and Corridors Lighting Table 7.16 Company Mapping for Loading Docks Lighting www.bisresearch.com
Global Intelligent Lighting Controls Market – Analysis and Forecast (2017-2023) LIST OF TABLE Table 7.17 Company Mapping for Parking Areas Lighting Table 7.18 Company Mapping for Architectural Lighting Table 7.19 Company Mapping for Street Lights Table 7.20 Company Mapping for Smart City Lighting Table 7.21 Company Mapping for Parking Lighting Table 7.22 Company Mapping for Public Areas Lighting Table 8.1 Global Intelligent Lighting Controls Market Breakdown by Region, Units Million (2016 – 2023) Table 8.2 Global Intelligent Lighting Controls Market Breakdown by Region, $Million (2016 – 2023) Table 8.3 North America Intelligent Lighting Control Market Breakdown by Country, Units Million (2016 – 2023) Table 8.4 North America Intelligent Lighting Control Market Breakdown by Country, $Million (2016 – 2023) Table 8.5 Asia Pacific Intelligent Lighting Control Market Breakdown by Country, Units Million (2016 – 2023) Table 8.6 Asia Pacific Intelligent Lighting Control Market Breakdown by Country, $Million (2016 – 2023) Table 8.7 Europe Intelligent Lighting Control Market Breakdown by Country, Units Million (2016 – 2023) Table 8.8 Europe Intelligent Lighting Control Market Breakdown by Country, $Million (2016 – 2023) Table 8.9 Rest of the World Intelligent Lighting Controls Market Breakdown by Country, Units Million (2016 – 2023) Table 8.10 Rest of the World Intelligent Lighting Controls Market Breakdown by Country, $Million (2016 – 2023) www.bisresearch.com
Global Intelligent Lighting Controls Market – Analysis and Forecast (2017-2023) LIST OF FIGURES Figure 1 Global Intelligent Lighting Controls Market Size Figure 2 Sensors Segment is leading among all the Component Types Figure 3 Wired Technology is Leading Among Both the Connection Type Figure 4 LED Generated Maximum Revenue Figure 5 Residential Application Generated Maximum Revenue Figure 6 North America Leading the Global Intelligent Lighting Controls Market Figure 1.1 Scope of the Report Figure 1.2 Secondary Data Sources Figure 1.3 Top Down and Bottom up Approach Figure 1.4 Intelligent Lighting Controls Market Influencing Factors Figure 1.5 Assumptions and Limitations Figure 2.1 Market Dynamics Figure 2.2 Rapidly Increasing Atmospheric Carbon Dioxide Concentration (PPMV) Globally Figure 2.3 Decreasing Average selling Price of LED Bulbs (2009-2020) Figure 2.4 Types of Security Concerns at Commercial Offices Figure 3.1 Key Strategies and Developments Figure 3.2 OLED Shipments (2013-2016) Figure 3.3 Porter’s Five Forces for the Intelligent Lighting Controls Market Figure 3.4 Analysis of Leading Player Figure 3.5 Research and Development Expenditure, $Million Figure 4.1 Intelligent Lighting Controls Market Segmentation Figure 4.2 Global Intelligent Lighting Controls Market in 2017 and 2023 Figure 4.3 Intelligent Lighting Controls – Component Type Market Figure 4.4 Component Type Market Size, 2017 and 2023 Figure 4.5 Sensors Market Size in Intelligent Lighting Controls Industry Figure 4.6 Sensors Market by Application Figure 4.7 Sensors Market by Connection Type Figure 4.8 Sensors Market by Region Figure 4.9 Ballasts and LED Drivers Market Size in Intelligent Lighting Controls Industry Figure 4.10 Ballasts and LED Drivers Market by Application Figure 4.11 Ballasts and LED Drivers Market by Connection Type Figure 4.12 Ballasts and LED Drivers Market by Region Figure 4.13 Microprocessors and Microcontrollers Market Size in Intelligent Lighting Controls Industry Figure 4.14 Microprocessors and Microcontrollers Market by Application Figure 4.15 Microprocessors and Microcontrollers Market by Connection Type Figure 4.16 Microprocessors and Microcontrollers Market by Region Figure 4.17 Lifespan of LED Lights in Comparison to Internal Temperature Figure 4.18 Switches and Dimmers Market Size in Intelligent Lighting Controls Industry Figure 4.19 Switches and Dimmers Market by Application Figure 4.20 Switches and Dimmers Market by Connection Type Figure 4.21 Switches and Dimmers Market by www.bisresearch.com
Global Intelligent Lighting Controls Market – Analysis and Forecast (2017-2023) LIST OF FIGURES Region Figure 8.3 North America Intelligent Lighting Control Market by Country Figure 8.4 Asia Pacific Intelligent Lighting Control Market by Country Figure 8.5 Europe Intelligent Lighting Control Market by Country Figure 8.6 Rising Smart Phone Penetration Rate Figure 8.7 Rest of the World Intelligent Lighting Controls Market by Country Figure 9.1 General Electric – Overall Financials, 2013-2015 Figure 9.2 General Electric– Business Segment Revenue Mix, 2013-2015 ($Million) Figure 9.3 General Electric– Geographic Revenue Mix, 2013-2015 ($Billion) Figure 9.4 General Electric– SWOT Analysis Figure 9.5 Lutron Electronics – SWOT Analysis Figure 9.6 Leviton Manufacturing – SWOT Analysis Figure 9.7 Honeywell International Inc. – Overall Financials, 2014-2016 Figure 9.8 Honeywell International Inc. – Business Segment Revenue Mix, 2014-2016 ($Million) Figure 9.9 Honeywell International Inc. – Geographic Revenue Mix, 2014-2016 ($Million) Figure 9.10 Honeywell International Inc. – SWOT Analysis Figure 9.11 Acuity Brands – Overall Financials, 2014-2016 Figure 9.12 Acuity Brands – Geographic Revenue Mix, 2014-2016 ($Million) Figure 9.13 Acuity Brands – SWOT Analysis Figure 9.14 Cree, Inc. – Overall Financials, 2014-2016 ($Million) Figure 9.15 Cree, Inc. – Business Segment Revenue Mix, 2014-2016 ($Million) Figure 4.22 Transmitters and Receivers Market Size in Intelligent Lighting Controls Industry Figure 4.23 Transmitters and Receivers Market by Application Figure 4.24 Transmitters and Receivers Market by Connection Type Figure 4.25 Transmitters and Receivers Market by Region Figure 5.1 Intelligent Lighting Controls – Connection Type Market Figure 5.2 Connection Type Market Size, 2017 and 2023 Figure 5.3 Price Comparison between Wired and Wireless Technology Installation Figure 5.4 Wired Intelligent Lighting Controls Market Figure 5.5 Wireless Intelligent Lighting Controls Market Figure 6.1 Intelligent Lighting Controls – Light Source Market Figure 6.2 Intelligent Lighting Controls Market Size by Light Source, 2017 and 2023 Figure 6.3 Intelligent Lighting Controls Market by FL Figure 6.4 Intelligent Lighting Controls Market by LED Figure 6.5 Intelligent Lighting Controls Market by HID Figure 7.1 Intelligent Lighting Controls – Applications Market Figure 7.2 Intelligent Lighting Controls Market Size by Applications, 2017 and 2023 Figure 8.1 Global Intelligent Lighting Controls Market by Region Figure 8.2 Global Intelligent Lighting Control Market by Region www.bisresearch.com
Global Intelligent Lighting Controls Market – Analysis and Forecast (2017-2023) LIST OF FIGURES Figure 9.16 Cree, Inc. – Geographic Revenue Mix, 2014-2016 ($Million) Figure 9.17 Cree, Inc. – SWOT Analysis Figure 9.18 Cree, Inc. – SWOT Analysis Figure 9.19 Koninklijke Philips N.V. – Overall Financials, 2014-2016 ($Billion) Figure 9.20 Koninklijke Philips N.V. – Business Segment Revenue Mix, 2014-2016 ($Billion) Figure 9.21 Koninklijke Philips N.V. – Geographic Revenue Mix, 2013- 2015 ($Billion) Figure 9.22 Koninklijke Philips N.V. – SWOT Analysis Figure 9.23 OSRAM Licht AG – Overall Financials, 2014-2016($Billion) Figure 9.24 OSRAM Licht AG – Business Segment Revenue Mix, 2014-2016 ($Million) Figure 9.25 OSRAM Licht AG – Geographic Revenue Mix, 2014-2016 ($Billion) Figure 9.26 OSRAM Licht AG – SWOT Analysis Figure 9.27 Legrand – Overall Financials, 2014-2016($Million) Figure 9.28 Legrand – Geographic Revenue Mix, 2014-2016 ($Billion) Figure 9.29 Legrand – SWOT Analysis Figure 9.30 LSI Industries, Inc. – Overall Financials, 2014-2016 ($Million) Figure 9.31 LSI Industries, Inc. – Business Segment Revenue Mix, 2014-2016 ($Million) Figure 9.32 LSI Industries, Inc. – Geographic Revenue Mix, 2014-2016 ($Million) Figure 9.33 LSI Industries, Inc. – SWOT Analysis Figure 9.34 CONTROL4 CORPORATION – Overall Financials, 2014-2016 ($Million) Figure 9.35 CONTROL4 CORPORATION – Geographic Revenue Mix, 2014- 2016 ($Million) Figure 9.36 CONTROL4 CORPORATION – SWOT Analysis Figure 9.37 Eaton – Overall Financials, 2013- 2015 Figure 9.38 Eaton – Business Segment Revenue Mix, 2013-2015 ($Million) Figure 9.39 Eaton – Geographic Revenue Mix, 2013-2015 ($Million) Figure 9.40 Eaton– SWOT Analysis Figure 9.41 Schneider Electric– Overall Financials, 2014-2016 Figure 9.42 Schneider Electric – Business Segment Revenue Mix, 2014-2016 ($Million) Figure 9.43 Schneider Electric – Geographic Revenue Mix, 2014-2016 ($Million) Figure 9.44 Schneider Electric – SWOT Analysis www.bisresearch.com
Global Intelligent Lighting Controls Market – Analysis and Forecast (2017-2023) DISCLAIMER BIS Research provides valuable market intelligence to an exclusive group of customers in response to orders. The report is licensed for the customer’s internal use only and is subject to restrictions set henceforth. This document and its contents are confidential and may not be further distributed, published or reproduced, in whole or in part, by any medium or in any form for any purpose, without the express written consent of BIS Research. Customer will not disclose the contents of the report, whether directly in any media or indirectly through incorporation in a database, marketing list, report or otherwise, or use or permit the use of Information to generate any statistical or other information that is or will be provided to third parties; or voluntarily produce Information in legal proceedings. Market reports are based on expectations, estimates and projections as of the date such information is available. Any recommendation contained in this report may not be suitable for all investors or businesses. The market conclusions drawn are necessarily based upon a number of estimates and assumptions that, while considered reasonable by BIS Research as of the date of such statements, are inherently subject to market fluctuations and business, economic and competitive uncertainties and contingencies. For more details regarding permission, please contact us: Email: sales@bisresearch.com Tel: +1 650 228 0182 www.bisresearch.com