Download
1 / 12
120 likes | 184 Views
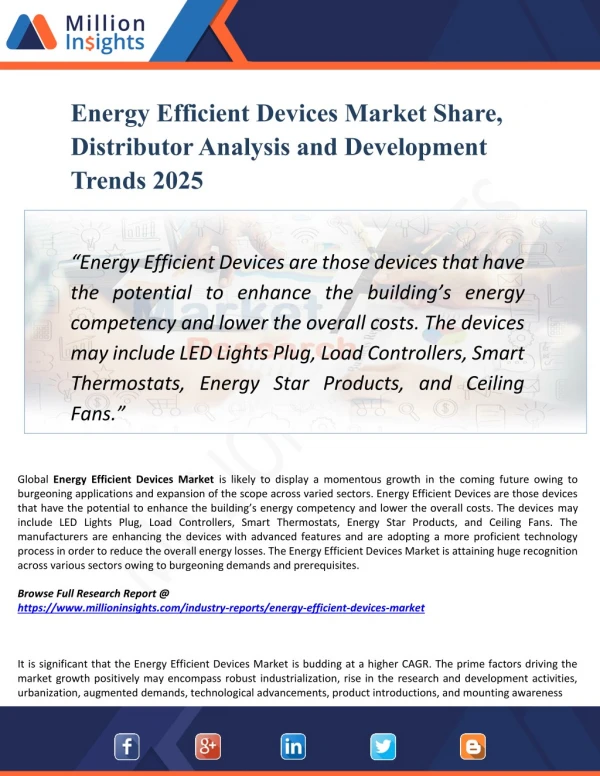
Increased level of energy consumption in the present era has gradually led to a number of negative effects such as depletion of natural resources, global warming, and degradation of environment, among others across the globe.

E N D
Global Energy Efficient Devices Market, Analysis & Forecast: 2016 to 2022; (Focus on Product Types; Applications and Regions) Increased level of energy consumption in the present era has gradually led to a number of negative effects such as depletion of natural resources, global warming, and degradation of environment, among others across the globe. Sustainable development in the future depends largely on the efficient utilization of the available resources, therefore, understanding the importance of energy efficiency is crucial. The following figure exhibits the global energy efficient devices market size: Global Energy Efficient Device Market Value ($Billion) XX 1,000.00 900.00 800.00 700.00 XX 600.00 XX 500.00 400.00 300.00 200.00 100.00 - 2015 2016 2022 BIS Research Analysis The global energy efficient devices market was valued at $XX billion in 2015 and is expected to reach $XX billion by 2022, growing at CAGR of XX% between 2016 and 2022. The increasing demand for reduction in energy consumption and greenhouse gas emissions along with concerns over climatic changes are some of the factors driving the overall market growth. www.bisresearch.com
Global Energy Efficient Devices Market, Analysis & Forecast: 2016 to 2022; (Focus on Product Types; Applications and Regions) The following key questions are answered in the “Global Energy Efficient Devices Market, 2016-2022” report: • Who are the major players in the global energy efficient devices market and their respective company profiles? • What are the key market developments and strategies of significant players in the energy efficient devices market? • What are the major drivers, challenges and opportunities for the energy efficient devices market? • What is the market size (value) of the energy efficient HVAC products? • What is the market size (value) of energy efficient consumer electronics and appliances? • What is the market size (value) of smart lighting? • What is the market size (value) of smart electric meters? • What is the market size (value) of different energy efficient devices across different application verticals such as residential, commercial and industrial segments? • What is the market size (value) of different energy efficient devices across different regions such as North America, Europe, Asia Pacific and Rest of the World? www.bisresearch.com
Global Energy Efficient Devices Market, Analysis & Forecast: 2016 to 2022; (Focus on Product Types; Applications and Regions) Analysis & Forecast: Base Year: 2015 Annual Estimated Forecast (2016-2022) Market, By Product Type: Heating, Ventilation and Air Conditioning (HVAC) Energy Efficient Devices, Consumer Electronics and Appliances, Smart Electric Meters, and Smart Lighting Market, By Applications: Residential, Commercial And Industrial Market by Region: North America, Europe, Asia Pacific, and Rest of the World www.bisresearch.com
Global Energy Efficient Devices Market, Analysis & Forecast: 2016 to 2022; (Focus on Product Types; Applications and Regions) TABLE OF CONTENTS Executive Summary 5.1 Assumptions and Limitations for Analysis and Forecast of the Global Energy Efficient Devices Market 1 Research Scope and Methodology 1.1 Scope of the Report 5.2 Market Overview 1.2 Global Energy Efficient Devices Market Research Methodology 5.3 The Global Energy Efficient Devices Market by Product Type 2 Market Dynamics 5.3.1 Heating , Ventilation and Air Conditioning (HVAC) Energy Efficient Devices 2.1 Market Drivers 2.1.1 Rising Energy Prices 5.3.2 Consumer Electronics and Appliances 2.1.2 Regulatory Reforms and Initiatives 5.3.3 Smart Electric Meters 2.1.3 Issue of Global Warming 5.3.4 Smart Lighting 2.2 Market Challenges 5.4 The Global Energy Efficient Devices Market by Applications 2.2.1 Financial Barrier 2.2.2 Awareness Among Individuals and Lack of Market Demand 5.4.1 Residential Application Vertical 5.4.2 Commercial Application Vertical 2.2.3 Interoperability Issue and Lack of Industry Standards 5.4.3 Industrial Application Vertical 5.5 The Global Energy Efficient Devices Market by Geography 2.3 Market Opportunities 2.3.1 Development of Smart Cities 5.5.1 North America 2.3.2 Technological Advancement such as IoT 5.5.2 Europe 3 Competitive Landscape 5.5.3 Asia Pacific (APAC) 3.1 Key Market Developments & Strategies 5.5.4 Rest of the World (ROW) 3.1.1 Product Launches and Developments 6 Company Profiles 3.1.2 Collaborations, Joint Ventures & Partnerships 6.1 GE Electric 6.1.1 Company Overview 3.1.3 Business Expansion 6.1.2 Financials 3.1.4 Mergers and Acquisitions 6.1.2.1 Financial Summary 3.2 Industry Attractiveness 6.1.3 SWOT Analysis 4 Industry Analysis 6.2 Cree Inc 4.1 Patent Analysis 6.2.1 Company Overview 4.2 Consortium, Association and Regulatory Bodies 6.2.2 Financials 6.2.2.1 Financial Summary 4.3 Supply Chain Analysis 6.2.3 SWOT Analysis 5 The Global Energy Efficient Devices Market, Analysis and Forecast 6.3 Aclara www.bisresearch.com
Global Energy Efficient Devices Market, Analysis & Forecast: 2016 to 2022; (Focus on Product Types; Applications and Regions) TABLE OF CONTENTS 6.3.1 Company Overview 6.10.1 Company Overview 6.4 Koninklijke Philips N.V. 6.10.2 Financials 6.4.1 Company Overview 6.10.2.1 Financial Summary 6.4.2 Financials 6.10.3 SWOT Analysis 6.4.2.1 Financial Summary 6.11 Schneider Electric 6.4.3 SWOT Analysis 6.11.1 Company Overview 6.5 Honeywell 6.11.2 Financials 6.5.1 Company Overview 6.11.2.1 Financial Summary 6.5.2 Elster Group 6.11.3 SWOT Analysis 6.5.2.1 Company Overview 6.12 Samsung Electronics 6.5.3 Financials 6.12.1 Company Overview 6.5.3.1 Financial Summary 6.12.2 Financials 6.5.4 SWOT Analysis 6.12.2.1 Financial Summary 6.6 Crompton Greaves 6.12.3 SWOT Analysis 6.6.1 Company Overview 6.13 Itron 6.6.2 Overall Financials 6.13.1 Company Overview 6.6.2.1 Financial Summary 6.13.2 Financials 6.6.3 SWOT Analysis 6.13.2.1 Financial Summary 6.7 Osram Group 6.13.3 SWOT Analysis 6.7.1 Company Overview 6.14 Toshiba 6.7.2 Financials 6.14.1 Company Overview 6.7.2.1 Financial Summary 6.14.2 Financials 6.7.3 SWOT Analysis 6.14.2.1 Financial Summary 6.8 Acuity Brands 6.14.3 SWOT Analysis 6.8.1 Company Overview 6.15 Trane 6.8.2 Financials 6.15.1 Company Overview 6.8.2.1 Financial Summary 6.15.2 Ingersoll Rand 6.8.3 SWOT Analysis 6.15.3 Financials 6.9 Legrand 6.15.3.1 Financial Summary 6.9.1 Company Overview 6.15.4 SWOT Analysis 6.9.2 Financials 6.16 Carrier 6.9.2.1 Financial Summary 6.16.1 Company Overview 6.9.3 SWOT Analysis 6.16.2 Financials 6.10 Zumtobel Group 6.16.2.1 Financial Summary www.bisresearch.com
Global Energy Efficient Devices Market, Analysis & Forecast: 2016 to 2022; (Focus on Product Types; Applications and Regions) TABLE OF CONTENTS 6.16.3 SWOT Analysis 6.17 Mitsubishi 6.17.1 Company Overview 6.17.2 Financials 6.17.2.1 Financial Summary 6.17.3 SWOT Analysis 6.18 LG 6.18.1 Company Overview 6.18.2 Financials 6.18.2.1 Financial Summary 6.18.3 SWOT Analysis 6.19 Daikin 6.19.1 Company Overview 6.19.2 Financials 6.19.2.1 Financial Summary 6.19.3 SWOT Analysis www.bisresearch.com
Global Energy Efficient Devices Market, Analysis & Forecast: 2016 to 2022; (Focus on Product Types; Applications and Regions) LIST OF TABLE Table 1 Electric Power Consumption in Some Countries, 2009-2013 (KWH Per Capita) Table 2.1 Electricity Consumption in Major Countries, by kWh Per Capita (2011-2013) Table 2.2 Global Initiatives for Promoting Energy Efficient Devices by Governments Table 2.4 No. of IoT Companies Headquarters Globally Table 3.1 Product Launches and Developments Table 3.2 Collaborations, Joint Ventures & Partnerships Table 3.3 Business Expansions Table 3.4 Mergers and Acquisitions Table 3.5 Buyers and Suppliers in Global Energy Efficient Devices Market Table 3.6 Key Factors Considered for threat from New Entrants in Global Energy Efficient Devices Market Table 3.7 Key Factors Affecting Bargaining Power of Buyers in the Global Energy Efficient Devices Market Table 3.8 Key Factors affecting the Bargaining Power of Suppliers in the Global Energy Efficient Devices Market Table 3.9 Key Factors affecting Threat of Substitute Products or Services in the Global Energy Efficient Devices Market Table 3.10 Key Factors determining Rivalry among Existing Firms in the Global Energy Efficient Devices Market Table 4.1 Example of Some Recent Patents Table 4.2 Example of Some Regulatory Bodies, Associations, & Consortia Table 5.1 Energy Efficient Devices Market Value by Product Type, 2015-2022 Table 5.2 Energy Efficient Devices Market Value for HVAC by Application Vertical, 2015-2022 Table 5.3 Energy Efficient Devices Market Value for HVAC by Geography, 2015-2022 Table 5.4 Energy Efficient Consumer Electronics and Appliances Technical Description Table 5.5 Energy Efficient Devices Market Value for Consumer Electronics and Appliances by Application Vertical, 2015-2022 Table 5.6 Energy Efficient Devices Market Value for Consumer Electronics and Appliances by Geography, 2015-2022 Table 5.7 Comparison of Traditional Electric Meters and Smart Electric Meters Table 5.8 Energy Efficient Devices Market Value for Smart Electric Meters by Application Vertical, 2015-2022 Table 5.9 Energy Efficient Devices Market Value for Smart Electric Meters by Geography, 2015- 2022 Table 5.10 Energy Efficient Devices Market Value for Smart Lighting by Application Vertical, 2015-2022 Table 5.11 Energy Efficient Devices Market Value for Smart Lighting by Geography, 2015-2022 Table 5.12 Energy Efficient Devices Market Value by Application Vertical, 2015-2022 Table 5.13 Energy Efficient Market Value for Residential Application Vertical by Products, 2015-2022 Table 5.14 Energy Efficient Market Value for Residential Application Vertical by Geography, 2015-2022 Table 5.15 Energy Efficient Market Value for Commercial Application Vertical by Products, 2015-2022 Table 5.16 Energy Efficient Market Value for Commercial Application Vertical by Geography, 2015-2022 Table 5.17 Energy Efficient Market Value for Industrial Application Vertical by Products, 2015-2022 Table 5.18 Energy Efficient Market Value for Industrial Application Vertical by Geography, 2015-2022 www.bisresearch.com
Global Energy Efficient Devices Market, Analysis & Forecast: 2016 to 2022; (Focus on Product Types; Applications and Regions) LIST OF TABLE Table 5.19 Energy Efficient Devices Market Value by Geography, 2015-2022 Table 5.20 Electric Power Consumption in North America, 2009-2013 (KWH per capita) Table 5.22 North America Energy Efficient Devices Market Value by Product Type, 2015- 2022 Table 5.23 North America Energy Efficient Device Market Value by Application Vertical, 2015-2022 Table 5.24 Electric Power Consumption for major Countries in the EU Region, 2009-2013 (KWH per capita) Table 5.26 Europe Energy Efficient Devices Market Value by Product Type, 2015-2022 Table 5.27 Europe Energy Efficient Device Market Value by Application Vertical, 2015-2022 Table 5.28 Electric Power Consumption for major Countries in the APAC Region, 2009-2013 (KWH per capita) Table 5.30 APAC Energy Efficient Devices Market Value by Product Type, 2015-2022 Table 5.31 APAC Energy Efficient Device Market Value by Application Vertical, 2015-2022 Table 5.32 Electric Power Consumption for major Countries in the ROW Region, 2009-2013 (KWH per capita) Table 5.34 ROW Energy Efficient Devices Market Value by Product Type, 2015-2022 Table 5.35 ROW Energy Efficient Device Market Value by Application Vertical, 2015-2022 www.bisresearch.com
Global Energy Efficient Devices Market, Analysis & Forecast: 2016 to 2022; (Focus on Product Types; Applications and Regions) LIST OF FIGURES Figure 1 Global Energy Efficient Device Market Size ($Billion) Figure 1.1 Market Segmentation Figure 1.2 Secondary Data Sources Figure 1.3 Top Down Approach Figure 1.4 Global Energy Efficient Devices Market Influencing Factors Figure 1.5 Assumptions and limitations Figure 2.1 Market Dynamics Snapshot Figure 2.2 World Electricity Consumption in kWh per Capita (1995-2013) Figure 2.3 CO2 emission Parts Per Million (PPM) in the Atmosphere Figure 3.1 Competitive Landscape Figure 3.2 Recent Market Development Strategy Snapshot Analysis Figure 3.3 Porter’s Five Forces Analysis for Global Energy Efficient Devices Market Figure 4.1 Industry Analysis Segments Figure 4.2 Supply Chain Analysis Figure 5.2 Energy Efficient Devices Product Type Figure 5.4 HVAC Energy Efficient Devices Figure 5.5 Advantages of Energy Efficient HVAC Devices Figure 5.8 Key Energy Efficient HVAC Devices Providers Figure 5.9 Energy Efficient Consumer Electronics and Appliances Figure 5.10 Advantages of Energy Efficient Appliances Figure 5.13 Key Energy Efficient Consumer Electronics and Appliances Providers Figure 5.14 Smart Electric Meter Benefits Figure 5.17 Key Smart Electric Meters Providers Figure 5.18 Smart Lighting Market Products Figure 5.21 Key Smart Lighting Products Providers Figure 5.22 Energy Efficient Devices Market by Application Type Figure 5.24 Benefits of Energy Efficient Buildings Figure 5.27 Key Energy Efficient Products Providers for Residential Application Figure 5.30 Key Energy Efficient Products Providers for Commercial Application Figure 5.33 Key Energy Efficient Products Providers for Industrial Application Figure 5.34 Global Energy Efficient Devices Market by Geography Figure 6.1 GE: Overall Financials (2014-2015) Figure 6.2 GE: Revenue by Geography (2014-2015) Figure 6.3 GE: Revenue by Business Segment Figure 6.4 GE: SWOT Analysis Figure 6.5 Cree: Overall Financials (2014-2016) Figure 6.6 Cree: Revenue by Geography (2014-2016) Figure 6.7 Cree: Revenue by business segment (2014-2016) Figure 6.8 Cree: SWOT Analysis Figure 6.9 Philips: Overall financials (2014-2015) Figure 6.10 Philips: Revenue by business segment Figure 6.11 Philips: Revenue by Geography Figure 6.12 Koninklijke Philips: SWOT Analysis Figure 6.13 Honeywell: Overall financials (2014- 2015) Figure 6.14 Honeywell: Financials by business Segment Figure 6.15 Honeywell: Segmentation by Geography Figure 6.16 Honeywell: SWOT analysis Figure 6.17 Crompton greaves: overall financials (2014-2016) Figure 6.18 Crompton Greaves: Revenue by Geography Figure 6.19 Crompton Greaves: SWOT analysis Figure 6.20 Osram Group: Overall Financials (2014- 2016) Figure 6.21 Osram Group: Revenue by business Segment Figure 6.22 Osram Group: Revenue by Geography Figure 6.23 Osram Group: SWOT analysis www.bisresearch.com
Global Energy Efficient Devices Market, Analysis & Forecast: 2016 to 2022; (Focus on Product Types; Applications and Regions) LIST OF FIGURES Figure 6.24 Acuity Brands: Overall Financials (2014- 2016) Figure 6.25 Acuity Brands: Revenue by Geography Figure 6.26 Acuity Brands: SWOT Analysis Figure 6.27 Legrand: Overall Financials (2014-2015) Figure 6.28 Legrand: Revenue by Geography Figure 6.29 Legrand: SWOT analysis Figure 6.30 Zumtobel: Overall Financials (2014- 2015) Figure 6.31 Zumbtobel: Revenue by business segment Figure 6.32 Zumtobel: Revenue by geography Figure 6.33 Zumtobel: SWOT analysis Figure 6.34 Schneider Electric: Overall Financials (2014-2015) Figure 6.35 Schneider Electric: Revenue by business segment Figure 6.36 Schneider Electric: Revenue by geography Figure 6.37 Schneider Electric: SWOT Analysis Figure 6.38 Samsung: overall financials (2014-2015) Figure 6.39 Samsung: revenue by business segment (2014-2015) Figure 6.40 Samsung: Revenue by geography (2014- 2015) Figure 6.41 Samsung: SWOT Analysis Figure 6.42 Itron: Overall Financials (2014-2015) Figure 6.43 Itron: Revenue by Segment (2014-2015) Figure 6.44 Itron: Revenue by Geography (2014- 2015) Figure 6.45 Itron: SWOT Analysis Figure 6.46 Toshiba: overall financials (2014-2016) Figure 6.47 Toshiba: Revenue by business segments (2014-2016) Figure 6.48 Toshiba: Revenue by geography (2014- 2016) Figure 6.49 Toshiba: SWOT Analysis Figure 6.50 Ingersoll Rand: Overall financials (2014- 2016) Figure 6.51 Ingersoll Rand: Revenue by business segment (2014-2015) Figure 6.52 Ingersoll Rand: Revenue by geography (2014-2015) Figure 6.53 Ingersoll Rand: SWOT Analysis Figure 6.54 Carrier: overall financials (2014-2015) Figure 6.55 United technologies: overall financials (2013-2015) Figure 6.56 United technologies: Revenue by business segment Figure 6.57 United technologies: Revenue by geography Figure 6.58 United Technologies: SWOT Analysis Figure 6.59 Mitsubishi: overall financials (2014- 2016) Figure 6.60 Mitsubishi: Revenue by business segments (2014-2016) Figure 6.61 Mitsubishi: Revenue by geography (2014-2016) Figure 6.62 Mitsubishi: SWOT Analysis Figure 6.63 L.G.: overall financials (2013-2015) Figure 6.64 L.G.: Revenue by business segments (2014-2015) Figure 6.65 L.G.: Revenue by geography (2014-2015) Figure 6.66 L.G.: SWOT Analysis Figure 6.67 Daikin: overall financials (2014-2016) 182 Figure 6.68 Daikin: Revenue by Geography (2014- 2016) Figure 6.69 Daikin: SWOT Analysis www.bisresearch.com
Global Energy Efficient Devices Market, Analysis & Forecast: 2016 to 2022; (Focus on Product Types; Applications and Regions) DISCLAIMER BIS Research provides valuable market intelligence to an exclusive group of customers in response to orders. The report is licensed for the customer’s internal use only and is subject to restrictions set henceforth. This document and its contents are confidential and may not be further distributed, published or reproduced, in whole or in part, by any medium or in any form for any purpose, without the express written consent of BIS Research. Customer will not disclose the contents of the report, whether directly in any media or indirectly through incorporation in a database, marketing list, report or otherwise, or use or permit the use of Information to generate any statistical or other information that is or will be provided to third parties; or voluntarily produce Information in legal proceedings. Market reports are based on expectations, estimates and projections as of the date such information is available. Any recommendation contained in this report may not be suitable for all investors or businesses. The market conclusions drawn are necessarily based upon a number of estimates and assumptions that, while considered reasonable by BIS Research as of the date of such statements, are inherently subject to market fluctuations and business, economic and competitive uncertainties and contingencies. For more details regarding permission, please contact us: Email: sales@bisresearch.com Tel: +1 650 228 0182 www.bisresearch.com