Download
1 / 11
110 likes | 134 Views
Largely, ARaaS model also has a limiting factor which eventually prompts companies to make a move toward following the ARaaP model. This limiting factor is majorly relevant for new and emerging companies which lack widespread global operations. ARaaS model is limited by the geographic position of the robots.

E N D
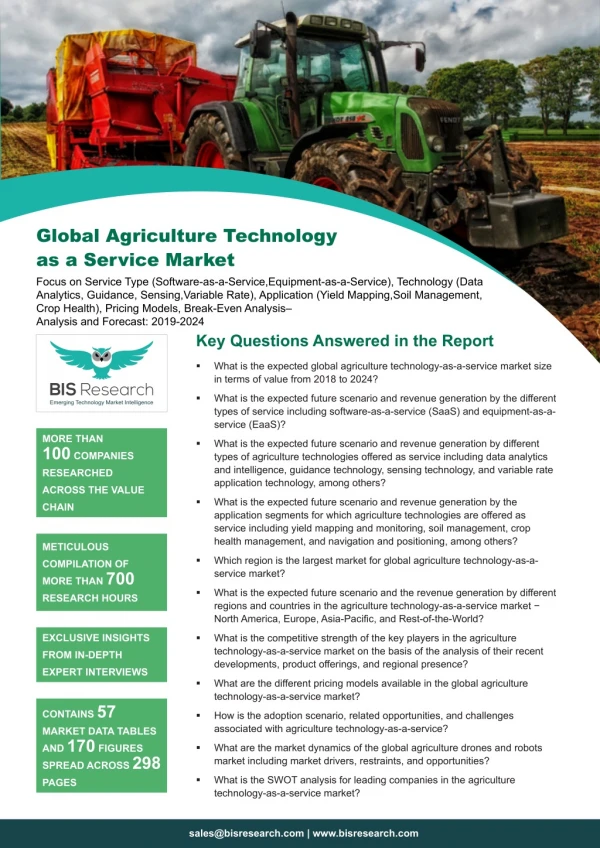
Global Agriculture Technology as a Service Market Focus on Service Type (Software-as-a-Service,Equipment-as-a-Service), Technology (Data Analytics, Guidance, Sensing,Variable Rate), Application (Yield Mapping,Soil Management, Crop Health), Pricing Models, Break-Even Analysis– Analysis and Forecast: 2019-2024 Key Questions Answered in the Report What is the expected global agriculture technology-as-a-service market size in terms of value from 2018 to 2024? What is the expected future scenario and revenue generation by the different types of service including software-as-a-service (SaaS) and equipment-as-a- service (EaaS)? MORE THAN 100 COMPANIES RESEARCHED What is the expected future scenario and revenue generation by different types of agriculture technologies offered as service including data analytics and intelligence, guidance technology, sensing technology, and variable rate application technology, among others? ACROSS THE VALUE What is the expected future scenario and revenue generation by the application segments for which agriculture technologies are offered as service including yield mapping and monitoring, soil management, crop health management, and navigation and positioning, among others? CHAIN METICULOUS Which region is the largest market for global agriculture technology-as-a- service market? COMPILATION OF MORE THAN 700 RESEARCH HOURS What is the expected future scenario and the revenue generation by different regions and countries in the agriculture technology-as-a-service market − North America, Europe, Asia-Pacific, and Rest-of-the-World? EXCLUSIVE INSIGHTS What is the competitive strength of the key players in the agriculture technology-as-a-service market on the basis of the analysis of their recent developments, product offerings, and regional presence? FROM IN-DEPTH EXPERT INTERVIEWS What are the different pricing models available in the global agriculture technology-as-a-service market? CONTAINS 57 MARKET DATA TABLES AND 170 FIGURES SPREAD ACROSS 298 PAGES How is the adoption scenario, related opportunities, and challenges associated with agriculture technology-as-a-service? What are the market dynamics of the global agriculture drones and robots market including market drivers, restraints, and opportunities? What is the SWOT analysis for leading companies in the agriculture technology-as-a-service market? sales@bisresearch.com | www.bisresearch.com
Table of Contents Impact Analysis Market Drivers Market Restraints Market Opportunities SCOPE & RESEARCH METHODOLOGY Report Scope Global Agriculture Technology-as-a- Service Market Segmentation Global Agriculture Technology- as-a-Service Market Research Methodology COMPANY PROFILES Key Market Developments & Strategies Product Launches and Developments MARKET DYNAMICS Partnerships, Collaborations, and Joint Ventures Agriculture OEMs AGCO Corporation CLAAS Group CNH Industrial N.V. Deere & Company Kubota Corporation Yanmar Co. Ltd. Yamaha Motor Co. Ltd Data Analytics & Intelligence Companies 365FarmNet GmbH Agrivi CropIn Technology Solutions Pvt. Ltd. Fujitsu Ltd. IBM Corporation Microsoft Corporation Robert Bosch GmbH Trimble Inc. Agriculture UAV/Drone Companies Parrot SA Pixhawk PrecisionHawk Inc. SZ DJI Technology Co. Ltd. Agriculture Robot Companies Harvest Automation Inc. Naio Technologies Small Robot Company Other Agriculture Technology Companies Accenture plc Airbus S.A.S AT&T Inc. Ceres Imaging Inc. Hexagon Agriculture Intertek Group plc Nutrien AgSolutions Raven Industries SGS S.A. Taranis Teejet Technologies Topcon Corporation Business Expansions and Contracts Mergers and Acquisitions COMPETITIVE LANDSCAPE Other Key Developments and Strategies Competitive Benchmarking Pricing Models Break-Even Analysis Advanced Solutions Agriculture Robot-as-a-Service (ARaaS) INDUSTRY ANALYSIS Agriculture Drone-as-a-Service (ADaaS) GLOBAL AGRICULTURE TECHNOLOGY-AS-A-SERVICE MARKET (BY SERVICE TYPE) Software-as-a-Service (SaaS) Equipment-as-a-Service (EaaS) Data Analytics & Intelligence Guidance Technology Sensing Technology Variable Rate Application Technology Others GLOBAL AGRICULTURE TECHNOLOGY-AS-A-SERVICE MARKET (BY TECHNOLOGY) Yield Mapping & Monitoring Soil Management Crop Health Management Navigation & Positioning Others GLOBAL AGRICULTURE TECHNOLOGY-AS-A-SERVICE MARKET (BY APPLICATION) North America Agriculture Technology- as-a-Service Market (by Country) Europe Agriculture Technology-as-a- Service Market (by Country) Asia-Pacific Agriculture Technology-as- a-Service Market (by Country) Rest-of-the-World Agriculture Technology-as-a-Service Market (by Country) GLOBAL AGRICULTURE TECHNOLOGY-AS-A-SERVICE MARKET (BY REGION) VIEW COMPLETE TABLE OF CONTENT sales@bisresearch.com | www.bisresearch.com
List of Tables 1. Impact Analysis of Market Drivers 24. RoW Agriculture Technology-as-a-Service Market (by Country), $Million, 2018-2024 2. Impact Analysis of Market Restraints 25. AGCO Corporation: Service Portfolio 3. Summary Table of Satellite Sensor Features 26. CLAAS Group: Service Portfolio 4. Cost Features of Satellite Sensors 27. CNH Industrial N.V.: Service Portfolio 5. Key Players with ARaaS Business Model and their Products 28. Deere & Company: Service Portfolio 6. Key Players with ARaaS Business Model and their Products 29. Kubota Corporation: Service Portfolio 30. Yanmar Co. Ltd: Service Portfolio 7. Global Agriculture Technology-as-a-Service Market (by Service Type), $Million, 2018-2024 31. 365FarmNet GmbH: Product Portfolio 32. Agrivi: Service Portfolio 8. Key Players with SaaS Service Type 33. CropIn Technology Solutions Pvt Ltd.: Product Portfolio 9. Key Players with EaaS Service Type 10. Global Agriculture Technology-as-a-Service Market (by Technology), $Million, 2018-2024 34. Fujitsu Limited: Product Portfolio 35. IBM Corporation: Product Portfolio 11. Key Data Analytics & Intelligence Services in Global ATaaS Market 36. Microsoft Corporation: Product Portfolio 37. Robert Bosch GmbH: Service Portfolio 12. Key Guidance Technology Services in Global ATaaS Market 38. Trimble Inc.: Service Portfolio 39. Parrot SA: Service Portfolio 13. Key Sensing Technology Services in Global ATaaS Market 40. Pixhawk: Service Portfolio 14. Key Variable Rate Application Technology Services in Global ATaaS Market 41. PrecisionHawk Inc. Service Portfolio 42. SZ DJI Technology Co. Ltd: Product Portfolio 15. Global Agriculture Technology-as-a-Service Market (by Application), $Million, 2018-2024 43. Harvest Automation Inc.: Service Portfolio 44. Naio Technologies: Product Portfolio 16. Key Yield Mapping and Monitoring Services in Global ATaaS Market 45. Small Robot Company: Product Portfolio 46. Accenture plc: Product Portfolio 17. Key Soil Management Services in Global ATaaS Market 47. Airbus S.A.S.: Service Portfolio 18. Key Crop Health Management Services in Global ATaaS Market 48. AT&T: Service Portfolio 49. Ceres Imaging Inc.: Product Portfolio 19. Key Navigation and Positioning Services in Global ATaaS Market 50. Hexagon Agriculture: Product Portfolio 51. Intertek Group plc: Services Portfolio 20. Global Agriculture Technology-as-a-Service Market (By Region), $Million, 2018-2024 52. Nutrien AgSolutions, Inc.: Service Portfolio 53. Raven Industries Inc.: Service Portfolio 21. North America Agriculture Technology-as-a-Service Market (by Country), $Million, 2018-2024 54. SGS S.A.: Services Portfolio 55. Taranis: Product Portfolio 22. Europe Agriculture Technology-as-a-Service Market (by Country), $Million, 2018-2024 56. Teejet Technologies: Product Portfolio 23. Asia-Pacific Agriculture Technology-as-a-Service Market (by Country), $Million, 2018-2024 57. Topcon Corporation: Service Portfolio sales@bisresearch.com | www.bisresearch.com
List of Figures 1. Macroeconomic Trends Impacting the Farming Industry Growth 23. Graphical Representation of Break-Even Analysis 24. Mathematical Representation of Break-Even Analysis 2. Future Agriculture Field Scenario with Smart Farm Technologies 25. Break-Even Point of Satellite Images (ha) 3. Drivers and Restraints: Global Agriculture Technology-as-a-Service Market 26. Service Type in Global Agriculture Technology-as-a- Service Market 4. Global Agriculture Technology-as-a-Service Market Snapshot 27. Advantages of Agriculture SaaS Service Type 28. Software-as-a-Service in Global Agriculture Technology-as-a-Service Market (by Service Type), $Million, 2018-2024 5. Global Agriculture Technology-as-a-Service, by Service Type, 2019 and 2024 6. Global Agriculture Technology-as-a-Service Market (by Technology), $Million 2019 and 2024 29. Key Applications of AI & ML in Agriculture 30. Growth of Equipment-as-a-Service with Agriculture Technology 7. Global Agriculture Technology-as-a-Service Market (by Application), $Million 2019 and 2024 31. Equipment-as-a-Service in Global Agriculture Technology-as-a-Service Market (by Service Type), $Million, 2019-2024 8. Regional Agriculture Technology-as-a-Service Market, $Million, 2019-2024 9. Market Dynamics and Impact Analysis 32. Advantages of Equipment-as-a-Service 10. The Global Agricultural Productivity Index, 2004- 2050 33. Applications in Global Agriculture Technology-as-a- Service Market 11. The U.S. Farm Expenditure Vs. Income Statistics, 2011-2017 34. Technologies in Global Agriculture Technology-as-a- Service Market 12. Strategies Adopted by the Key Players (May 2016- May 2019) 35. Advantages of Data Analytics for Agriculture Industry 36. Data Analytics & Intelligence in Global Agriculture Technology-as-a-Service Market (by Technology), $Million, 2018-2024 13. Share of Key Market Strategies and Developments (May 2016 - May 2019) 14. Product Launches and Development Share (by Company) 37. Guidance Technology in Global Agriculture Technology-as-a-Service Market (by Technology), $Million, 2018-2024 15. Partnerships, Collaborations and Joint Ventures Share (by Company) 38. Sensing Technology in Global Agriculture Technology-as-a-Service Market (by Technology), $Million, 2018-2024 16. Business Expansion and Contract Share (by Company) 17. Mergers and Acquisitions Share (by Company) 39. Variable Rate Application Technology in Global Agriculture Technology-as-a-Service Market (by Technology), $Million, 2018-2024 18. Competitive Benchmarking Matrix 19. Advantages-Disadvantages of Bundled Per Acre Model 40. Other Technologies in Global Agriculture Technology- as-a-Service Market (by Technology), $Million, 2018- 2024 20. Advantages-Disadvantages of Per Pass/Service Model 41. Applications in Global Agriculture Technology-as-a- Service Market 21. Advantages-Disadvantages of Percentage of Yield Bump/Gain Model 42. Applications in Global Agriculture Technology-as-a- Service Market 22. Advantages-Disadvantages of Per Unit of Product Sold Model sales@bisresearch.com | www.bisresearch.com
List of Figures 43. Yield Mapping and Monitoring in Global Agriculture Technology-as-a-Service Market (by Application), $Million, 2018-2024 62. Rest-of-Europe Agriculture Technology-as-a-Service Market, $Million, 2018-2024 63. Asia-Pacific Agriculture Technology-as-a-Service Market, $Million, 2018-2024 44. Soil Management in Global Agriculture Technology- as-a-Service Market (by Application), $Million, 2018- 2024 64. Asia-Pacific Agriculture Technology-as-a-Service Market (By Country), $Million, 2018-2024 45. Crop Health Management in Global Agriculture Technology-as-a-Service Market (by Application), $Million, 2018-2024 65. Major Field of Innovation in Agriculture Technology (by CSIRO Australia) 66. Australia and New Zealand Agriculture Robots Market, $Million, 2018-2024 46. Navigation and Positioning in Global Agriculture Technology-as-a-Service Market (by Application), $Million, 2018-2024 67. Employment in Agriculture (% of total employment) in China, 1991 and 2017 47. Other Applications in Global Agriculture Technology- as-a-Service Market (by Application), $Million, 2018- 2024 68. China Agriculture Technology-as-a-Service Market, $Million, 2018-2024 69. Japan Agriculture Technology-as-a-Service Market, $Million, 2018-2024 48. Global Agriculture Technology-as-a-Service Market, Market Share and CAGR (By Region) 70. India Agriculture Technology-as-a-Service Market, $Million, 2018-2024 49. North America Agriculture Technology-as-a-Service Market, $Million, 2018-2024 71. Rest-of-Asia-Pacific Agriculture Technology-as-a- Service Market, $Million, 2018-2024 50. North America Agriculture Technology-as-a-Service Market (by Country), $Million, 2018-2024 72. Rest-of-the-World Agriculture Technology-as-a- Service Market, $Million, 2018-2024 51. The U.S. Agriculture Technology-as-a-Service Market, $Million, 2018-2024 73. Brazil Agriculture Technology-as-a-Service Market, $Million, 2018-2024 52. Use of Guidance Technologies by ATaaS Retailers in U.S., $Million, 2005-2017 74. Argentina Agriculture Technology-as-a-Service Market, $Million, 2018-2024 53. Use of Sensing Technologies by ATaaS Retailers in U.S., $Million, 2005-2017 75. Israel Agriculture Technology-as-a-Service Market, $Million, 2018-2024 54. Canada Agriculture Technology-as-a-Service Market, $Million, 2018-2024 76. South Africa Agriculture Technology-as-a-Service Market, $Million, 2017-2028 55. Rest-of-North America Agriculture Technology-as-a- Service Market, $Million, 2018-2024 77. Rest-of-RoW Agriculture Technology-as-a-Service Market, $Million, 2018-2024 56. Europe Agriculture Technology-as-a-Service Market, $Million, 2018-2024 78. Share of Key Companies 57. Europe Agriculture Technology-as-a-Service Market (By Country), $Million, 2018-2024 79. AGCO Corporation: Overall Financials, 2016-2018 80. AGCO Corporation: Net Revenue by Major Products 2016-2018 58. Germany Agriculture Technology-as-a-Service Market, $Million, 2018-2024 81. AGCO Corporation: Net Revenue by Regional Segment 2016-2018 59. The U.K. Agriculture Technology-as-a-Service Market, $Million, 2018-2024 82. AGCO Corporation: SWOT Analysis 60. France Agriculture Technology-as-a-Service Market, $Million, 2018-2024 83. CLAAS Group: Overall Financials, 2016-2018 61. Italy Agriculture Technology-as-a-Service Market, $Million, 2018-2024 sales@bisresearch.com | www.bisresearch.com
List of Figures 84. CLAAS Group: Net Revenue by Regional Segment 2016-2018 112. Microsoft Corporation: Net Revenue by Business Segment, 2016-2018 85. CLAAS Group: SWOT Analysis 113. Microsoft Corporation: Net Revenue by Regional Segment, 2017-2018 86. CNH Industrial N.V.: Overall Financials, 2016-2018 114. Microsoft Corporation: SWOT Analysis 87. CNH Industrial: Net Revenue by Business Segments 2016-2018 115. Robert Bosch GmbH: Overall Financials, 2016-2018 88. CNH Industrial N.V.: Net Revenue by Regional Segment 2016-2018 116. Robert Bosch GmbH: Net Revenue by Operating Segment, 2016-2018 89. CNH Industrial N.V.: SWOT Analysis 117. Robert Bosch GmbH: Net Revenue by Regional Segment, 2016-2018 90. Deere & Company: Overall Financials, 2016-2018 118. Robert Bosch GmbH: SWOT Analysis 91. Deere & Company: Net Revenue, by Business Segment, 2016-2018 119. Trimble Inc.: Overall Financials, 2016-2018 92. Deere & Company: Net Revenue, by Regional Segment, 2016-2018 120. Trimble Inc.: Net Revenue by Operating Segment 2016-2018 93. Deere & Company: SWOT Analysis 121. Trimble Inc.: Net Revenue by Regional Segment 2016-2018 94. Kubota Corporation: Overall Financials, 2016-2018 122. Trimble Inc.: SWOT Analysis 95. Kubota Corporation: Net Revenue by Segments 2016-2018 123. Parrot SA: Overall Financials, 2015-2017 96. Kubota Corporation: Net Revenue by Regional Segment 2016-2018 124. Parrot SA: Net Revenue (by Business Segment), 2015 97. Kubota Corporation: SWOT Analysis 125. Parrot SA: Net Revenue (by Business Segment), 2016-2017 98. Yanmar Co. Ltd.: Overall Financials, 2016-2018 126. Parrot SA: Net Revenue by Regional Segment 2015- 2017 99. Yanmar Co. Ltd: SWOT Analysis 100. 365FarmNet GmbH: SWOT Analysis 127. Parrot SA: SWOT Analysis 101. Agrivi: SWOT Analysis 128. Pixhawk: SWOT Analysis 102. CropIn Technology Solutions Pvt Ltd.: SWOT Analysis 129. PrecisionHawk Inc.: SWOT Analysis 130. SZ DJI Technology Co. Ltd: SWOT Analysis 103. Fujitsu Limited: Overall Financials, 2016-2018 131. Harvest Automation Inc.: SWOT Analysis 104. Fujitsu Limited: Net Revenue by Operating Segment 2016-2018 132. Naio Technologies: SWOT Analysis 105. Fujitsu Limited: Net Revenue by Regional Segment 2016-2018 133. Small Robot Company: SWOT Analysis 134. Accenture plc: Overall Financials, 2016-2018 106. Fujitsu Limited: SWOT Analysis 135. Accenture plc: Net Revenue by Business Segment, 2016-2018 107. IBM Corporation: Overall Financials, 2016-2018 108. IBM Corporation: Net Revenue by Business Segment, 2016-2018 136. Accenture plc: Net Revenue by Regional Segment 2016-2018 109. IBM Corporation: Net Revenue by Regional Segment, 2016-2018 137. Accenture plc: SWOT Analysis 138. Airbus S.A.S.: Overall Financials, 2016-2018 110. IBM Corporation: SWOT Analysis 139. Airbus S.A.S.: Net Revenue by Operating Segment 2016-2018 111. Microsoft Corporation: Overall Financials, 2016-2018 sales@bisresearch.com | www.bisresearch.com
List of Figures 140. Airbus S.A.S.: Net Revenue by Regional Segment 2016-2018 156. Raven Industries Inc.: SWOT Analysis 157. SGS S.A.: SWOT Analysis 141. Airbus S.A.S.: SWOT Analysis 158. Taranis: SWOT Analysis 142. AT&T: Overall Financials, 2016-2018 159. Teejet Technologies: SWOT Analysis 143. AT&T: Net Revenue by Operating Segment 2016- 2018 160. Topcon Corporation: Overall Financials, 2016-2018 161. Topcon Corporation: Net Revenue by Business Segments 2016-2018 144. AT&T: Net Revenue by Regional Segment 2016- 2018 162. Topcon Corporation: Net Revenue by Regional Segment 2016-2018 145. AT&T: SWOT Analysis 146. Ceres Imaging Inc.: SWOT Analysis 163. Topcon Corporation: SWOT Analysis 147. Hexagon Agriculture: SWOT Analysis 164. Agriculture Technology-as-a-Service Market Scope 148. Intertek Group plc: Overall Financials, 2016-2018 165. Global Agriculture Technology-as-a-Service Market Segmentation 149. Intertek Group plc: Net Revenue by Operating Segment 2016-2018 166. Report Methodology 150. Intertek Group plc: Net Revenue by Regional Segment 2016-2018 167. Primary Interviews Breakdown, by Player, Designation, and Region 151. Intertek Group plc: SWOT Analysis 168. Sources of Secondary Research 152. Nutrien AgSolutions, Inc.: SWOT Analysis 169. Data Triangulation 153. Raven Industries Inc.: Overall Financials, 2016-2018 170. Top Down-Bottom-Up Approach for Market Estimation 154. Raven Industries Inc.: Net Revenue by Segments 2016-2018 155. Raven Industries Inc.: Net Revenue by Regional Segment 2016-2018 sales@bisresearch.com | www.bisresearch.com
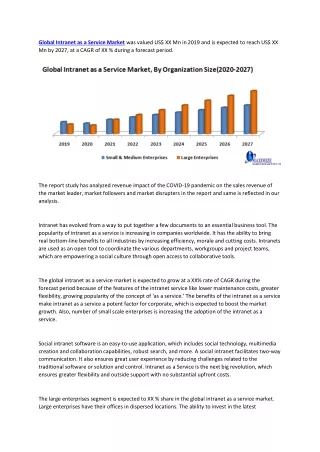
Research Scope & BIS Methodology 1. Scope of the Report The report is a thorough study of the global agriculture technology-as-a-service market share and market size including the analysis by different service types, technologies, and applications. The agriculture technology-as-a-service market has also been extensively analyzed in this report including the market trends across the geographical regions across the world. Further, the market estimated in different sections of the report considered “2019-2024” as the forecast period. 2. Global Agriculture Technology-as-a-Service Market Research Methodology The research methodology design adopted for this specific study includes a mix of data collected from primary and secondary sources. The research exhaustively use both primary sources (in-house experts, industry leaders and market players) and secondary sources (a host of paid and unpaid databases) along with analytical tools to build forecast and predictive models. Figure 1: Research Methodology Scope Definition Research Design Market Study Qualitative Quantitative Primary Interviews/ Secondary Research Top Down and Bottom Up Primary & Secondary Data Data Validation Data Analysis Data Collection Report Writing sales@bisresearch.com | www.bisresearch.com
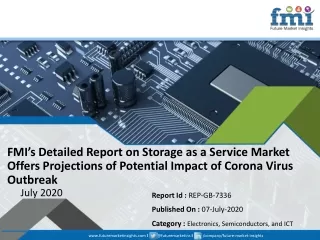
Research Scope & BIS Methodology Primary Data Sources The primary sources involve the industry experts from the robotics, drone, and agriculture industries. In the extensive primary research process undertaken for this study, the primary sources further include industry experts and key executives from prominent companies, research organizations and agricultural research associations. All such resources have been interviewed to obtain and verify both the qualitative and the quantitative aspects of this research study. The key data points taken from the primary sources include: Validation and triangulation of all the numbers and graphs Validation of report’s segmentation and key qualitative findings Understanding the competitive landscape Validation of the numbers of the various market segments for smart farming Percentage split for country analysis The research includes interviews with participants throughout the value chain. An extensive questionnaire was shared to get insights from the experts who didn’t participate in discussions. In some cases where information was not available, Delphi method was used to arrive at mutual consent with BIS consultants. Secondary Data Sources The research study involves the usage of extensive secondary sources, directories, company websites, annual reports and investor presentations. It also makes use of databases, such as Hoovers, Bloomberg, Business-week, and Factiva to collect useful and effective information for an extensive, market-oriented, and commercial study of the global market. Secondary research was done to obtain crucial information about the industry’s value chain, market’s monetary chain, total pool of key players, and the prevalent solutions and applications. Figure 2: Secondary data Sources MARKET SIZE (VALUE AND VOLUME) MARKET SIZE (VALUE AND VOLUME) MARKET SIZE (VALUE AND VOLUME) Sources: Company Websites Annual Reports Press Releases BIS Data Repository Sources: Company Financials Magazines Journals Press Releases Paid Databases BIS Data Repository Sources: Annual Reports Company Websites Public Databases BIS Data Repository sales@bisresearch.com | www.bisresearch.com
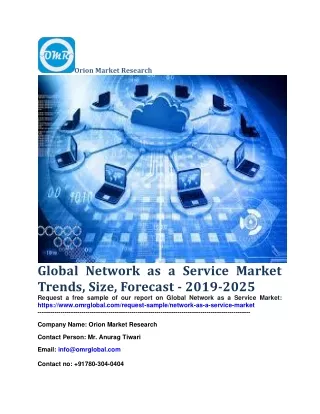
Research Scope & BIS Methodology Figure 3: Data Triangulation The process of market engineering involves calculation of the market statistics, market size estimation, market forecast, market crackdown, and data triangulation (the methodology for these quantitative data processes is explained in the further sections). An extensive primary research study was undertaken to gather information, and authenticate the critical numbers arrived through segmentation types, industry trends, and key players of each type of products and services in the market. The following figure exhibits data triangulation considered: BIS Research Internal Repository Key Players Competitive Landscape Opportunities/Challenges Market Size and Market Share (2018-2024) Macro-Economic Factors Market Estimates Regional Analysis Bis Research Internal Repository DATA TRIANGULATION Primary Sources Secondary Sources Primary Sources Secondary Sources Demand Side Stockmen Agronomists OEMs System Integrators Agriculture Consultants Service Providers Component Manufacturers Distributors Interview With: Annual Reports of Key Industrial Players SEC Filings 10K Reports Investor Presentations Journals Press Releases Paid and Unpaid Databases Food & Agriculture Organization Reports USDA Foreign Agricultural Service Reports REQUEST FOR SAMPLE sales@bisresearch.com | www.bisresearch.com
BIS Research 39111 Paseo Padre PKWY STE 313, Fremont CA 94538-1686, Tel: +1-510-404-8135 Global Delivery Centre Tapasya Corp Heights, Subarea, Sector 126, Noida, NCR-201303 India Tel: +91 120 4261540 / +91 120 4261544 To know more about us, please visit our website: bisresearch.com For other queries contact: sales@bisresearch.com sales@bisresearch.com | www.bisresearch.com sales@bisresearch.com | www.bisresearch.com