Download
1 / 22
220 likes | 397 Views
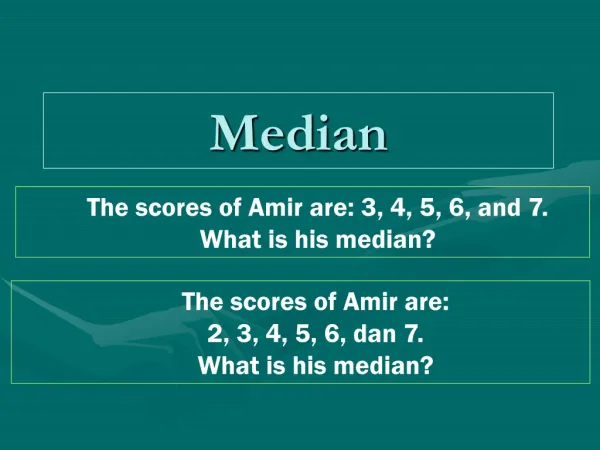
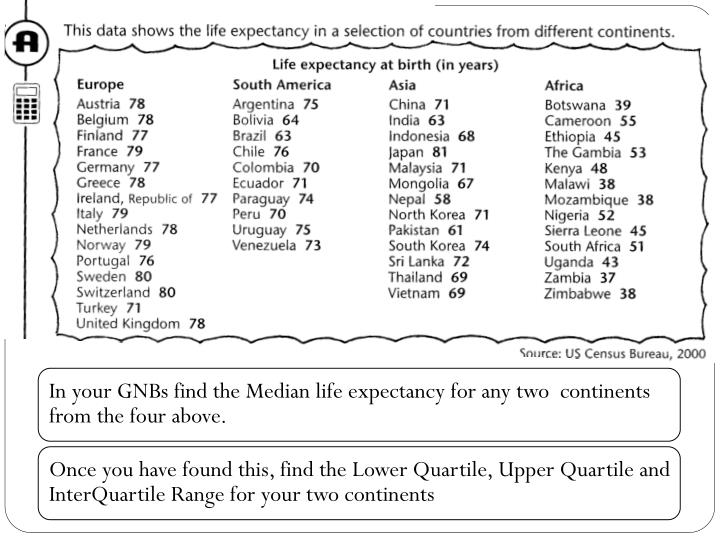
Europe: Median = 78, LQ = 77, UQ = 79 S. America: Median = 72, LQ = 70, UQ = 75 Asia: Median = 69, LQ = 65, UQ = 71.5 Africa: Median = 45, LQ = 38, UQ = 51.5. Year 11: IAR #1 Revision. Area of Triangles Sine & Cosine Rule Cumulative frequency diagrams Box & Whisker

E N D
Europe: Median = 78, LQ = 77, UQ = 79 S. America: Median = 72, LQ = 70, UQ = 75 Asia: Median = 69, LQ = 65, UQ = 71.5 Africa: Median = 45, LQ = 38, UQ = 51.5
Year 11: IAR #1 Revision Area of Triangles Sine & Cosine Rule Cumulative frequency diagrams Box & Whisker Histograms
Side-Angle-Side OR Side-Side-Side SAS or SSS Cosine Rule
4 22 90 169 200
200 150 4 Cumulative freq 22 100 90 169 200 50 30 40 80 0 50 60 70 Hours worked
x 200 x 150 4 Cumulative freq 22 100 90 x 169 200 50 x x x 30 40 80 0 50 60 70 Hours worked
x 200 x 150 4 Cumulative freq 22 100 90 x 169 200 50 x x x 30 40 80 0 50 60 70 Hours worked
x 200 x 150 4 Cumulative freq 22 100 90 x 169 200 50 LQ = 55 hours x x x 30 40 50 80 0 60 70 Hours worked
x 200 x 150 4 Cumulative freq 22 100 90 x 169 200 50 LQ = 55 hours x LQ = 68 hours x x 30 40 80 0 50 60 70 Hours worked
x 200 x 150 4 Cumulative freq 22 100 90 x 169 200 50 LQ = 55 hours x LQ = 68 hours IQR = 68 – 55 = 13 hours x x 30 40 80 0 50 60 70 Hours worked
x 200 x 150 4 Cumulative freq 22 100 90 x 169 200 50 If we’d been asked for the median x Median = 62 hours x x 30 40 80 0 50 60 70 Hours worked
The projected population of the U.K. for 2005 ( by age ) A box and whisker diagram can easily be drawn using a cumulative frequency diagram. I’ll use the age data from the previous presentation. The box can be any depth. minimum age One whisker The box The other whisker median maximum age lower quartile upper quartile
minimum age median maximum age lower quartile upper quartile The diagram can easily be drawn using a cumulative frequency diagram. The projected population of the U.K. for 2005 ( by age ) I’ll use the age data from the previous presentation.
0 50 100 Age (years) The diagram can easily be drawn using a cumulative frequency diagram. The projected population of the U.K. for 2005 ( by age ) I’ll use the age data from the previous presentation. We need a scale.
Now draw a box and whisker plot from a given set of data (i.e. not a cumulative freqdiag) P459 Q9
Page 458 Q7