Download
1 / 51
510 likes | 642 Views
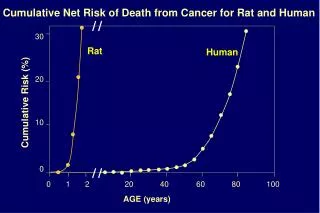
Cumulative Net Risk of Death from Cancer for Rat and Human. 30. Rat. Human. 20. Cumulative Risk (%). 10. 0. 1. 2. 20. 40. 60. 80. 100. 0. AGE (years). e -. e -. e -. e -. H 2 O. O 2. O 2 -. H 2 O 2. • OH. 2. Estimated oxidative DNA adducts per rat liver cell. 70,000.

E N D
Cumulative Net Risk of Death from Cancer for Rat and Human 30 Rat Human 20 Cumulative Risk (%) 10 0 1 2 20 40 60 80 100 0 AGE (years)
e- e- e- e- H2O O2 O2- H2O2 •OH 2
Estimated oxidative DNA adducts per rat liver cell 70,000 Old (26-mo) 60,000 67,000 50,000 40,000 30,000 Young (4-mo) 20,000 24,000 10,000 0
carbonyl content (nmol/mg protein) In carbonyl content (nmol/mg protein) 6 2 5 4 1 3 2 0 20 40 60 80 100 0 * 3 12 20 26 Months Years E. Stadtman, Science 257, 1220-1224 (1992)
H+ H+ H+ H+ H+ H+ H+ H+ H+ H+ H+ H+ H+ H+ H+ H+ H+ H+ H+ H+ H+ H+ H+ CITRIC ACID CYCLE Cellular Cytoplasm Mitochondrial Outer Membrane Intermembrane Space I CoQ Inner Membrane CytC III II V IV NADH Mitochondrial Matrix NAD+ FAD O2 FADH2 ADP H2O Succinate ATP Fumarate ATP Succinyl-Co-A -Ketoglutarate Dehydrogenase Complex NADH L-Malate NADH -Ketoglutarate Pyruvate Dehydrogenase complex NADH Oxaloacetate NADH Isocitrate Citrate Acetyl-Co-A Citrate Synthase 9
Intermembrane Space O O R R C C S-CoA S-CoA O O R R C C Carnitine Carnitine Matrix Carnitine acyltransferase II Carnitine Carnitine CoA-SH CoA-SH Carnitine acyltransferase I 12
L-Carnitine/Acetyl-L-Carnitine (ALCAR) • Transports long-chain fatty acids into mitochondria • Removes short- and medium-chain fatty acids that accumulate • Mediates the ratio of acetyl-CoA/CoA • Decreases with age in plasma and in brain • Improves cognitive function in rats 12
30 20 Cardiolipin (µg per 10 cells) 10 0 Effect of ALCAR Supplementation on Cardiolipin Levels + ALCAR Old Young 14
R123 Fluorescence in Young and Old Rat Hepatocytes YOUNG NO ALCAR Normalized Cell Number WITH ALCAR OLD NO ALCAR WITH ALCAR Normalized Cell Number
R--Lipoic Acid (LA) in mitochondria • LA reduced to dihydrolipoic acid, a potent antioxidant, & chelator of Fe & Cu • Coenzyme of pyruvate and -ketoglutarate dehydrogenases • Involved with carbohydrate utilization for ATP production • Improves cognitive function in aged mice 15
Lipoic Acid Lowers Mitochondrial Oxidants in Old Rats ** 20 Fl. Units/O2 Consumed per Minute 10 + LA + LA 0 Young Old 17
R-Lipoic Acid Restores Cellular Ascorbate 8 6 Ascorbate (nmol/105 cells) 4 ALCAR + LA ALCAR + LA ALCAR ALCAR 0 Old Young 18
Effect of R-Lipoic Acid [LA] Supplementation on GSH Levels + ALCAR 20 10 GSH (nmol/106 cells) + LA + ALCAR + LA +ALCAR + LA + LA 0 Young Old 19
MDA levels in young and old rats with LA, ALCAR, or both 80 P<0.05 ***p<0.001 vs. young rat group P<0.01 70 60 *** Young Old MDA (pmol/mg protein) 50 40 30 20 10 0 + LA + LA + ALCAR + ALCAR + LA + ALCAR + ALCAR + LA 20
1200 ** 150 # # 800 100 mM nmol/min/g ** 400 50 # 0 0 Km for ALCAR Km for CoA 10 10 1/v 1/v 5 5 0 0 -10 0 10 20 30 40 -50 0 50 100 150 200 1/[ALCAR, mM] 1/[CoA, mM] young old * = vs. young # = vs. old # # * Vmax
A B C C 29
Age-associated decrease in immune function and the effect of ALCAR (0.2%) + LA (0.1%) treatement for 2 months. Values are mean + SEM of 10-11 animals. P<0.001 3 0 p < 0 . 0 1 2 0 T cell stimulation index 1 0 0 Old Young Old Treated Young Treated
* 800 600 400 + LA + ALCAR 200 + LA + ALCAR 0 Young Old Ambulatory Activity before and After Supplementation with Lipoic Acid (LA) + Acetyl-L-Carnitine (ALCAR) vs. young * vs. old # # Distance Travelled (cm/hour/day) *
Morris Water Maze for Testing Spatial Memory Spatial Memory relies on intact hippocampal function. Treatments improved poor memory in old rats 22
Spatial Memory Tested With Morris Water Maze 100 P<0.001 P<0.05 80 60 40 + LA + ALCAR + ALCAR + LA 20 0 Young Old Old old Old 23
25 20 15 10 5 0 Platform quadrant Platform position Improvements in Spatial Memory of Old Rats Treated with ALCAR, LA, or Both *** Time (sec) Old + ALCAR + LA Old + ALCAR Old + LA Young Old Old + ALCAR + LA Old + ALCAR Old + LA *** ## Young # # Old 24
Peak procedure: for measuring temporal memory. Associated with striatum, cerebellum, & hippocampus 0 50 100 150 200 0 50 100 150 200 14 PEAKRATE: measures learning and motivation. 12.00 Young 12 Old 10.00 Old + ALCAR PEAK TIME: measures internal clock, food is rewarded only when animals push lever 40s after sound or light signal Old + LA 10 Old + ALCAR + LA 8.00 8 6.00 6 4.00 4.00 2.00 2.00 0.00 0.00 SOUND: Time to Signal LIGHT: Time to Signal 25
Oxidative Damage to Nucleic Acid in Old Rats by mAb to oxo8G/oxo8dG: Immunohistochemical stain of neurons 26
Staining of oxidized nucleic acid in neurons (mAb to oxo8dG in DNA/oxo8G in RNA) RNA is Oxidized (92% is removed by RNase) *oxo8G: 8-hydroxyguanosine; oxo8dG: 8-hydroxy-2’-deoxyguanosine 27
** * Dendritic spine density of cortical neurons in rat brain with Golgi staining: Effects of 11 month treatment with ALCAR, LA or ALCAR+LA 70 60 50 Spine density 40 30 20 10 0 Young Old +ALCAR +LA +ALCAR +LA Liu, Mervis, and Ames, Unpublished data
Meta-analysis of acetyl-L-carnitine versus placebo for mild cognitive impairment and mild Alzheimers disease Montgomery, S.A., Thal, L.J., and Amrein, R., Int. Clin. Psychopharmacol 18:61-71 (2003)
Treatment with alpha-lipoic acid significantly improves both neuropathic symptoms and deficits in diabetic patients with symptomatic diabetic neuropathy Professor Daniel Ziegler of the Diabetes Research Institute, Düsseldorf, Germany: Meta-Analysis Provides Highest Level of Evidence, Diabetes Monitor (2002, p6)
Life Expectancy of Men and Women at Birth 80 77.5 78.9 74.9 75 73.2 71.1 71.4 69.9 70 67.1 66.7 65.7 65.6 65 61.4 61.3 58 60 56.3 54.5 55 53.6 50.1 49 50 46.4 45 SOURCE: National Institute on Aging 40 1900 1910 1920 1930 1940 1950 1960 1970 1980 1990
ACKNOWLEDGEMENTS Children’s Hospital Oakland Research Institute University of California at Berkeley University of California at Irvine Linus Pauling Institute, Oregon State University Dr. Jiankang Liu Dr. Tory Hagen Dr. Afshin Gharib Dr. David Killilea Dr. Patrick Walter Dr. Hani Atamna Dr. Emily Ho Dr. Elizabeth Head Dr. Carl W. Cotman 35
Micronutrient Undernutrition in Americans Nutrient Population Group % ingesting <RDA <50% RDA % ingesting RDA Minerals Iron Women 20-30 years 18 mg 75% 25% Women 50+ years 8 mg 25% 5-10% Men; Women 50+ years 11; 8 mg 10% 50% Zinc Vitamins B6 Men; Women 1.7; 1.5 mg 50% 10% Folate** Men; Women 400 mcg 75% 25%; 50% B12 Men; Women 2.4 mcg 10-20; 25-50 % 5; ~10-25% C Men; Women 90; 75 mg 50% 25% •Wakimoto and Block (2001) J Gerontol A Biol Sci Med Sci. Oct; 56 Spec No 2(2):65-80. ** Before U.S. Food Fortification
Analysis of nonlinear regression models: comparison of an overall model and individual models of Z-transformed values vs. ln- nonheme liver iron 3 2.5 Over all 2 DCF-PMNs 1.5 DCF-Lymph 1 Rh123-PMNs Z score 0.5 Rh123-Lymph 0 mtDNA damage -0.5 1/RCR -1 normal -1.5 -1.5 -1 -0.5 0 0.5 1 1.5 2 2.5 LN nonheme Fe (µmol/g wet liver) . Each of the six dependent variables (that were analyzed by nonlinear regression in former figures) were transformed to Z scores and modeled as a quadratic function of the ln-liver nonheme iron as the independent variable. The equation for the RCR ratio's Z score was obtained from inverted RCR values (1/RCR) so that normal rats had the lower instead of the higher values. For presentation purposes each model line was obtained from 9 values of liver iron. All statistics were performed as in materials and methods.
Synthesis of Heme Cytosol PBG Other intermediates 2ALA PPIX PPGIX FeII FC protoheme Mitochondria Succ-CoA + Gly ALA
Similarity Between the Consequences of Heme Deficiency and Normal Aging/neurodegeneration Factor in Study Heme Deficiency Aging/Neurodegeneration 9 Complex IV Iron Oxidative Stress APP NOS Cell-cycle and differentiation Metabolism Calcium Ferrochelatase Heme synthesis Loss of complex IV Accumulation Increased Decreased and aggregate appear Increased Disabled differentiation or proliferation Mitochondrial decline Corrupted Increased Decreased Loss of complex IV Accumulation Increased dimmer or aggregate Increased Loss of Axons; neuronal death Hypometabolism Corrupted Increased in senescent cells Decreased with age** 11 9 11 11 11 9,10 9 9 9* 10 *Not Determined in vivo. **Not determined in the aging brain 9) Atamna et al (2001) JBC. 10) Atamna et al (2002) ABB. 11) Atamna et al (2002) PNAS.
Anemic Fe Def Anemic * : significant Other Anemic ADJUSTED ODDS RATIO FOR INADEQUATE PREGNANCY OUTCOME AMONG ANEMIC PREGNANT WOMEN Source: Scholl et al., AJCN 1992 * 3 * * 2 * ODDS RATIO 1 0 SMALL GEST. AGE LBW PRE TERM POOR WEIGHT GAIN
ACUTE/SEVERE DEFICIENCY OVERLOAD
Mean intake by ethnic group (mg) 20 yrs 40 yrs 60 yrs RDA 8 8 8 White 18 19 17 Black 18 16 13 Hispanic 17 16 15 Mean intake by ethnic group (mg) 20 yrs 40 yrs 60 yrs RDA 18 18 8 White 12 12 13 Black 12 11 11 Hispanic 13 12 11 Iron Deficiency
Zinc Deficiency Induces IncreasedOxidative Stress in C6 Glioma Cells * 140 120 100 Intensity (RFU) DCF Fluorescence 80 60 40 20 Control ZnAD ZnDF
Zinc Deficiency Induces Fapy Glycosylase (Fpg)-sensitive Single Strand Breaks in Human Lung Fibroblasts Control (+Fpg) ZnAD (+Fpg) ZnDF (+Fpg) * 200 160 120 Comet Score 80 40 0 Control ZnAD ZnDF
Mean intake by ethnic group (mg) 20 yrs 40 yrs 60 yrs RDA 11 11 11 White 15 14 13 Black 16 13 10 Hispanic 15 15 11 Mean intake by ethnic group (mg) 20 yrs 40 yrs 60 yrs RDA 8 8 8 White 9 10 10 Black 10 8 8 Hispanic 11 9 8 Zinc Deficiency
Mean intake by ethnic group (mg) 20 yrs 40 yrs 60 yrs RDA 400 420 420 White 358 361 333 Black 320 286 246 Hispanic 366 348 299 Mean intake by ethnic group (mg) 20 yrs 40 yrs 60 yrs RDA 310 320 320 White 243 359 265 Black 213 201 208 Hispanic 250 247 216 Magnesium Deficiency
Z E - 1 T K - 2 A W - 4 T B - 5 M R - 6 L S - 7 A B - 8 C H - 9 R B - 1 2 Y H C - 1 3 H P - 1 6 T S - 1 0 Human Lymphocyte DNA Strand Breaks (Comet Assay) vs. B-6 Intake 3 . 5 3 . 0 2 . 5 2 . 0 Avg 100 comets 1 . 5 1 . 0 0 . 5 0 . 0 B a s e l i n e 0 . 7 1 . 4 2 . 2 1 0 . 3 Vitamin B-6 Intake (mg/d) T. Shultz, C. Hansen, K. Hunt, J. Leklem, A. Huang, & B. Ames
Human Lymphocyte DNA Strand Breaks (Comet Assay) vs. B-6 Intake 3.5 3 2.5 2 1.5 1 0.5 0 0 2 4 6 8 10 12 Vitamin B-6 Intake
“The main distinguishing characteristic between man and the lower animals is the desire to take pills” Mark Twain