Download
1 / 62
620 likes | 786 Views
SYNOPTIC METEOROLOGY LABORATORY. The Dallas and Fort Worth Storms of May 5, 1995. BY: Brent Crisp, Phil Grigsby, Thomas Jones, Devon Lucie, Tim Love, Andrew Reader, and Matt Sattler. Presentation Outline. Synoptic Overview - Satellite imagery - Upper air maps - Soundings

E N D
SYNOPTIC METEOROLOGY LABORATORY The Dallas and Fort Worth Storms of May 5, 1995 BY: Brent Crisp, Phil Grigsby, Thomas Jones, Devon Lucie, Tim Love, Andrew Reader, and Matt Sattler
Presentation Outline Synoptic Overview - Satellite imagery - Upper air maps - Soundings - Composite Map Radar Summary - Reflectivity Products and cross sections - Velocity Products and cross sections - VIL Products - Hail Trends - Total Precip. Products Mesoscale Summary - Surface analysis - 850 mb features - Shear analysis - Radar products - Storm Wrap-up
Synoptic Overview of the Dallas and Fort Worth Storms of May 5, 1995
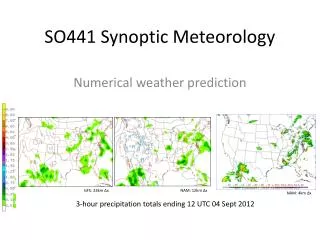
Dallas/Ft Worth Area Water Vapor Loop: May 5 1815Z to May 6 0615Z
• Diffluent Flow Over the Southern Plains 250 mb Heights and Observations
500 mb Shortwave 500 mb Heights and Observations
Weak Vort Max 12 s^-1 500 mb Vorticity Contours
Strong Flow from the Gulf, Bringing in Moisture at 850mb 850 mb Heights and Observations
10°-16°C Dew Points at 850mb 850 mb Dew point Temperatures
L 5:00 p.m. Surface Analysis
12Z May 5 00Z May 6 Soundings from DFW
• 250 mb diffluent flow Composite Map
• 250 mb diffluent flow • 500 mb shortwave Composite Map
• 250 mb diffluent flow • 500 mb shortwave • 850 mb dew point temperatures 10° - 16° C Composite Map
• 250 mb diffluent flow • 500 mb shortwave • 850 mb dew point temperatures • low-level jet Composite Map
• 250 mb diffluent flow • 500 mb shortwave • 850 mb dew point temperatures • low-level jet • stationary front Composite Map
• 250 mb diffluent flow • 500 mb shortwave • 850 mb dew point temperatures • low-level jet • stationary front • precipitable water values from 1.5-2.0 inches Composite Map
Radar Summary of the Dallas and Fort Worth Storms of May 5, 1995
Parker Co. Tarrant Co. Dallas Co. Base Reflectivity Loop from 6:04 p.m. to 8:59 p.m.
• 6:00 p.m DFW RADAR • Supercell located in SW Parker County • Squall line extends from Young to Eastern County • Reflectivity max at 60 dBz’s
• 6:00 p.m. DFW radar • South to North cross section • Bounded Weak Echo Region • Hail Core • Reflectivity max at 60 dBz’s Base Reflectivity Cross Section
• Max VIL 70-75 Kg/m^2 Location of Supercell 6:00 p.m. VIL Product from DFW
• 6:45 p.m. DFW radar • Supercell located in SE Parker County about to enter FTW metro • Squall line beginning to bow west of the supercell • Max Reflectivity of 75 dBz’s
• 6:45 p.m. DFW radar • South to North cross section • More pronounced Bounded Weak Echo Region • Hail Core • Reflectivity max at 75 dBz’s Base Reflectivity Cross Section
• Max VIL 60-65 Kg/m^2 6:45 p.m. VIL Product from DFW
strong meso • 6:45 p.m. DFW radar • Base Velocity product • Strongest meso WNW of radar site
• 6:45 p.m. DFW radar • West to East cross section • Meso evident within the Super- cell • Isentropic lift Base Velocity Cross Section
• Hail and severe hail probabilities at 100 % • Max hail size constant at 3+ inches • Slightly decreasing VIL values 6:00 p.m. - 6:45 p.m. Hail Trends
• 7:30 p.m. DFW radar • Supercell located in Tarrant County • Time of largest hail falling • Supercell is caught by the squall line • Max Reflectivity of 67 dBz’s
• 7:45 p.m. DFW radar • South to North cross section • Hail Core lessening • Lower dBz’s aloft • Reflectivity max at 67 dBz’s Base Reflectivity Cross Section
• Max VIL 45-50 Kg/m^2 7:30 p.m. VIL Product from DFW
• Hail and severe hail probabilities rapidly decrease after 7:20 p.m. • Max hail size from 3+ inches to less than an inch. • Decreasing VIL values 6:30 p.m. - 7:30 p.m. Hail Trends
• 8:00 p.m. DFW radar • Heavy precip threat beginning • Supercell is consumed by the squall line • Large area of reflectivity greater than 50 dBz
• 8:00 p.m. DFW radar • West to East cross section • Strong uplifting within the squall- line. Base Velocity Cross Section
Approx. 3 inches of rain in one hour One Hour Precip from 8:00 to 9:00 p.m.
• 9:00 p.m. DFW radar • South to North cross section • Very low dBz’s aloft • Reflectivity max at 55 dBz’s Base Reflectivity Cross Section
3.5 + inches of rain • 9:00 p.m. total precip image • Areas received over 3.5 inches of rain
Mesoscale Analysis of the Dallas and Fort Worth Storms of May 5, 1995
Inverted Trough L 5:00 p.m. Surface Analysis
• 850 mb moisture • Low-level jet • MesoHigh over LA 00Z May 6, 850 mb Moisture Transport
• Theta-E bulge • Inverted Trough 850 mb Theta-E Chart