Download
1 / 9
130 likes | 339 Views
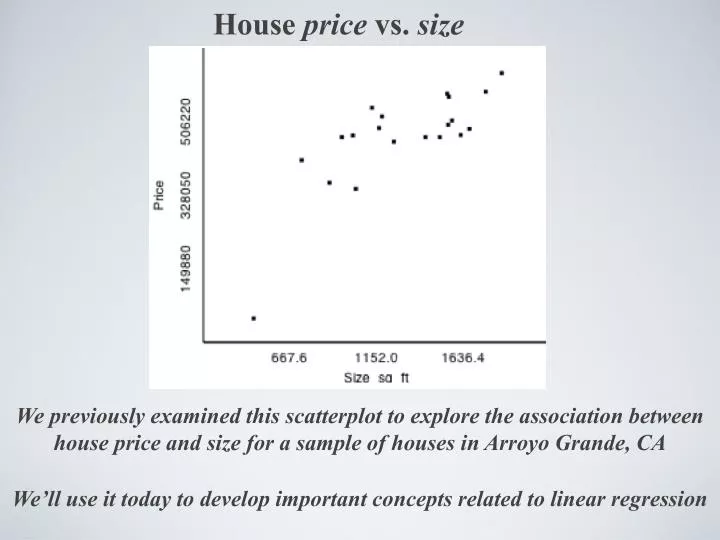
House price vs. size. We previously examined this scatterplot to explore the association between house price and size for a sample of houses in Arroyo Grande, CA. We ’ ll use it today to develop important concepts related to linear regression. House price vs. size.

E N D
House price vs. size We previously examined this scatterplot to explore the association between house price and size for a sample of houses in Arroyo Grande, CA We’ll use it today to develop important concepts related to linear regression
House price vs. size The total “error” that results from using the mean (y-bar) of the price variable to predict the price values yi is: This is the sum of the squared differences (residuals) between the mean and each value of the price variable. Think of SSE(y-bar) as a baseline amount of prediction error.
House price vs. size The total “error” that results from using the least squares regression equation (LSRE) of price vs size (y-hat = a + bx) to predict the values of price is: This is the sum of the squared differences (residuals) between the predicted values of price and the corresponding actual price for each case.
House price vs. size The “errors” for both prediction methods
House price vs. size Since each of SSE(y-bar) and SSE(y-hat) measure prediction error, then they each measure the amount of variability in Y (house price) that is NOT described by that respective prediction method. Measures the amount of variability in Y that is NOT described by using the mean (y-bar) as a predictor of y-values Measures the amount of variability in Y that is NOT described by using the LSRE (y-hat) as a predictor of y-values This ratio therefore measures the proportion of variability in Y that is NOT described by using the LSRE (y-hat) as a predictor of y-values [relative to the amount not described by using the mean as a predictor]
House price vs. size Measures the proportion of variability in Y that IS described/captured by using the LSRE (y-hat) as a predictor of y-values This quantity is called the coefficient of determination for the LSRE: It measures the percentage of variability in Y described by using the LSRE as the predictor of y-values. A non-trivial (and non-obvious) connection: where r is the correlation coefficient
Three important and non-obvious relationships for the LSRE (without proofs) The least squares regression equation (LSRE): Write an equation that corresponds to this statement: 2) This last equation gives a formula for the value of the intercept in the LSRE. 3) The value of the slope parameter in the LSRE is given by this formula:
House price vs. size Compute the value of each parameter and write a coherent interpretation of it: Slope b = Intercept a = Write the LSRE: How much of the variability in house price is accounted for by the LSRE?
House price vs. size Use the LSRE to predict the price of the house whose size is 1242 sq ft: How does the predicted price of that house compare to its actual price ($459,000)? Write an expression/equation for this comparison: